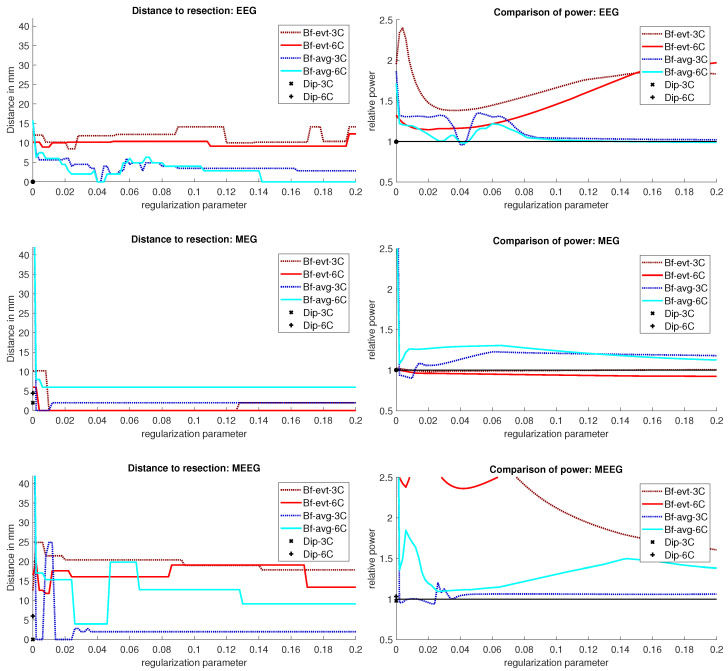
Figure 3.
Localization results for patient 1. The distance of the localization of the beamformer maximum to the resection volume for each regularization value from 0 to 0.2 in steps of 0.002 is shown on the left. The corresponding power relation, which is the maximum power outside the resection volume divided by the maximum inside, is depicted on the right. Each pair of graphs is specific to one modality: EEG, MEG, and MEEG, from top to bottom. The methods are color coded in the same way for all modalities: lighter colors and full lines are used for the 6 compartment, darker dotted lines for the 3 compartment head model.

