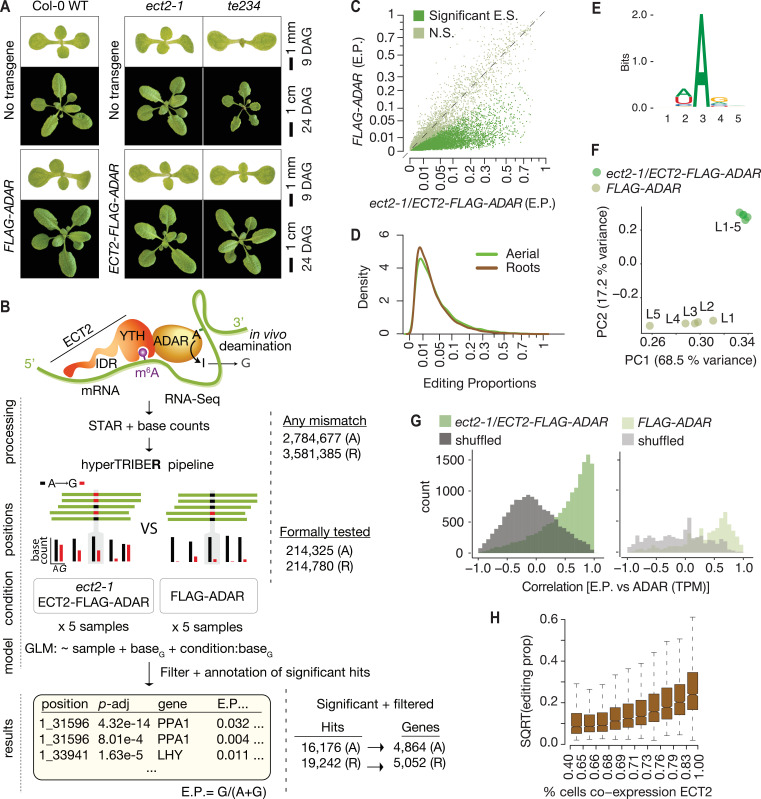
Figure 1. Drosophila ADARcd fused to ECT2 can edit target mRNAs in vivo in plants.
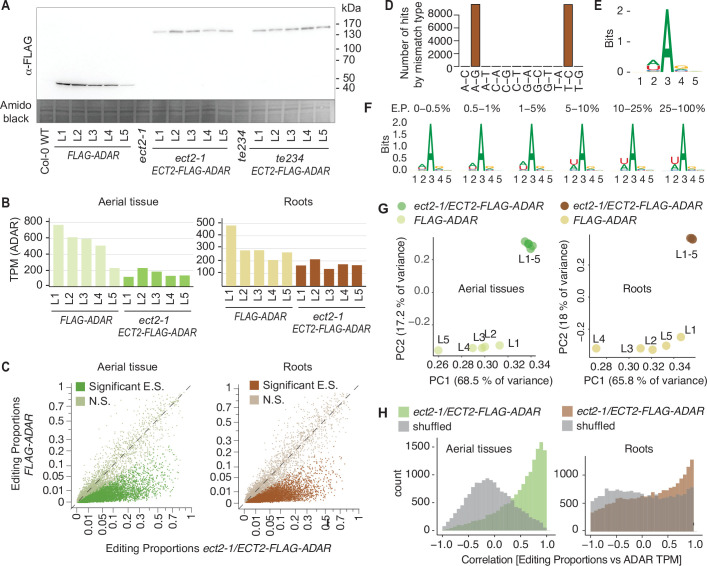
(A) Phenotypes of wild type, ect2-1 and te234 mutants with (lower panels) or without (upper panels) ECT2-FLAG-ADAR or FLAG-ADAR transgenes, at 9 or 24 days after germination (DAG). (B) Experimental design for ECT2-HyperTRIBE (ECT2-HT) target identification and hyperTRIBER pipeline (Rennie et al., 2021). Nucleotide base counts quantified from mapped RNA-seq libraries were passed into the hyperTRIBER pipeline to call significant editing sites, which were further filtered and annotated. The number of sites in either aerial (A, dissected apices) or root (R, root tips) tissues considered at each stage of the analysis is indicated. GLM, generalized linear model; E.P., editing proportion. (C) Scatterplot of the editing proportions of potential and significant editing sites (E.S.) in aerial tissues of ect2-1/ECT2-FLAG-ADAR lines compared to the FLAG-ADAR controls. Significant sites are highlighted in vivid green. N.S., not significant. (D) Density of editing proportions for significant editing sites in aerial tissues and roots of ect2-1/ECT2-FLAG-ADAR lines. (E) Consensus motif identified at significant editing sites in aerial tissues of ect2-1/ECT2-FLAG-ADAR lines. (F) Principal component analysis of editing proportions at significant editing sites in samples with aerial tissues. (G) Distribution of the correlations between editing proportions and ADAR expression (TPM) for significant editing sites in aerial tissues of either ect2-1/ECT2-FLAG-ADAR or FLAG-ADAR lines. Background correlations (gray) are based on randomly shuffling ADAR expression for each site. (H) Boxplots showing the mean editing proportions as a function of the proportion of cells co-expressing ECT2, calculated based on single cell RNA-seq in roots (Denyer et al., 2019). For panels C, E, F, and G, comparable analyses in both aerial and root tissues are shown in the Figure 1—figure supplement 1.


