. 2021 Sep 30;10:e72375. doi: 10.7554/eLife.72375

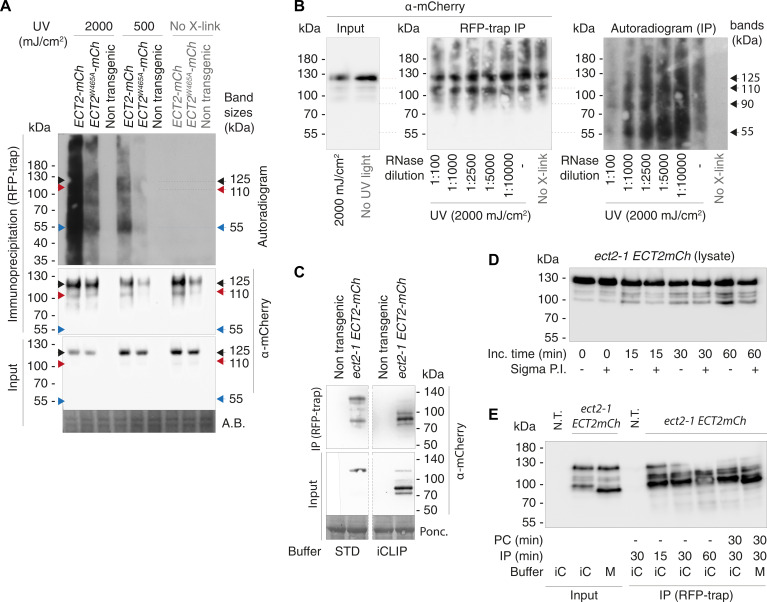
Figure 3. RNA-binding properties of ECT2 revealed by CLIP.

(A) iCLIP experimental design. (B) Upper panels: autoradiogram (top) and α-mCherry protein blot (below) of RFP-trap immuno-purifications. Samples are cell extracts from 12-day-old seedlings expressing ECT2-mCherry or ECT2W464A-mCherry in the ect2-1 mutant background after in vivo UV-crosslinking as indicated, and subjected to DNase digestion, partial RNase digestion, and 5’-32P labeling of RNA. Non-transgenic, Col-0 wild type. Lower panels: α-mCherry protein blot of the same extracts before immunoprecipitation (input) and Coomassie staining of the membrane. Sizes corresponding to full length ECT2-mCherry (~125 kDa) and the most apparent RNA bands are indicated with arrows. A repeat of the experiment with independently grown and crosslinked tissue is shown in the Figure 3—figure supplement 1A. (C) Schematic representation of ECT2-mCherry and HA-ECT2 fusion proteins with their apparent size (electrophoretic mobility). The molecular weight of each region is indicated. Notice that IDRs tend to show higher apparent sizes (lower electrophoretic mobility) than globular domains. (D) Equivalent to B with lines expressing 3xHA-ECT2 variants in the ect2-1 background, α-HA immuno-purifications and α-HA detection by western blot. (E) Cartoon illustrating the nature of the bands of labelled RNA co-purifying with ECT2-mCherry. Yellow stars indicate possible crosslinking sites. (F) Number of called peaks and genes detected from the four iCLIP libraries sequenced for this study (Figure 3—figure supplement 3). (G) Upset plot showing single and pairwise combinations of genes for the four sequenced iCLIP libraries. Additional intersections can be found in the Figure 3—figure supplement 4. (H) Metagene profiles depicting the enrichment along the gene body (5’UTR, CDS or 3’UTR) of the called iCLIP peaks detailed in F.

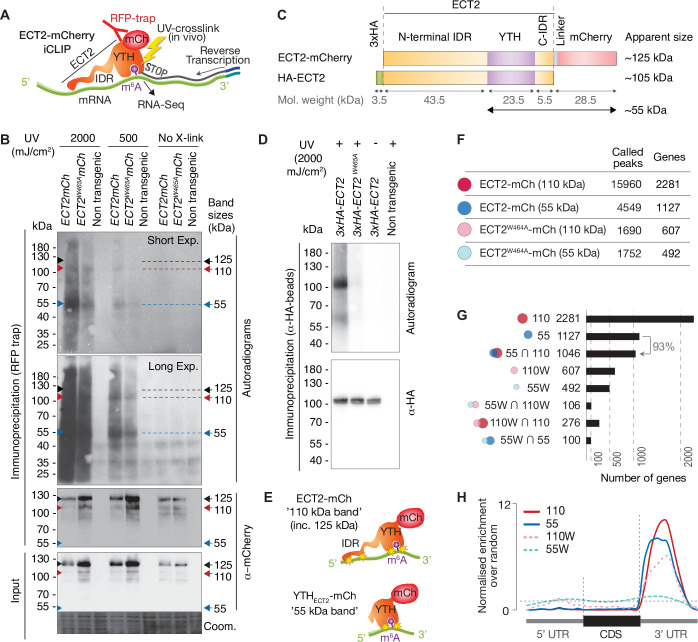
Figure 3—source data 1. Uncropped labelled panels and raw image files - Figure 3B, D.

Figure 3.

Figure 3—figure supplement 1. UV-crosslinked RNA co-purifies with ECT2-mCherry in a pattern that depends on the proteolytic cleavage of the ECT2 intrinsically disordered region (IDR) in the lysate.

Figure 3—figure supplement 1.

(A) Independent repeat of the CLIP experiment in Figure 3B. Sizes corresponding to full-length ECT2-mCherry (~125-kDa) (Figure 3C) and the most apparent RNA bands are indicated. (B) Same as (A) using a gradient of increasing concentrations of RNase I. Dilutions refer to the 100 U/μL stock, from which 5 μL were added to 100 μL reactions (e.g., 1:5000 corresponds to the final concentration of 1 U/mL used in all other CLIP experiments and for construction of iCLIP libraries). Note that the background in the IP-western blot is presumably due to lack of cooling during the 3-hr-long SDS-PAGE in this first experiment. (C) α-mCherry protein blot of lysates (input) or immunopurifications (RFP-trap) incubated for 1 hr at 4°C in either standard (STD) IP buffer (50 mM Tris-HCl, pH 7.5, 150 mM NaCl, 5 mM MgCl2, 10% glycerol, 4 mM DTT, 0.1% Nonidet P-40) or iCLIP buffer (50 mM Tris-HCl pH 7.5, 150 mM NaCl, 4 mM MgCl2, 5 mM DTT, 1% SDS, 0.25% sodium deoxycholate, 0.25% Igepal), both supplemented only with Roche EDTA-free Protease Inhibitor Cocktail (1 tablet/10 mL). All IP or input lanes have been developed identically on the same membrane. Dashed lines indicate cropping of lanes containing samples irrelevant for this work. Part of the input/non-transgenic/STD buffer sample lane was accidentally left out when the membrane was developed (the thin line indicates the border of the photograph), but the remaining half lane suggests absence of signal. (D) α-mCherry protein blot of cell extracts incubated for increasing amounts of time (at 4°C) in iCLIP buffer supplemented with 4 mM PMSF, 1 tablet/10 mL of Complete Protease Inhibitor Cocktail (Roche), and with or without Sigma Protease Inhibitor Optimized for Plant Extracts (1/30 vol). The progressive, protease inhibitor-sensitive appearance of <125kDa ECT2-mCherry species is evidence of their generation by proteolysis in the lysate. (E) α-mCherry protein blot of lysates (input) or immunopurifications (RFP-trap) from plants expressing ECT2-mCherry using different preclearing (PC) and immunoprecipitation (IP) times at 4°C, either in iCLIP buffer (iC) or in a milder (M) variant with ½ amount of detergents, both supplemented with 1 mM PMSF and 1 tablet/10 mL of Complete Protease Inhibitor Cocktail (Roche). Again, the progressive appearance of <125kDa ECT2-mCherry species with increasing incubation time is seen.
Figure 3—figure supplement 1—source data 1. Uncropped labeled panels and raw image files: Figure 3—figure supplement 1A-E.
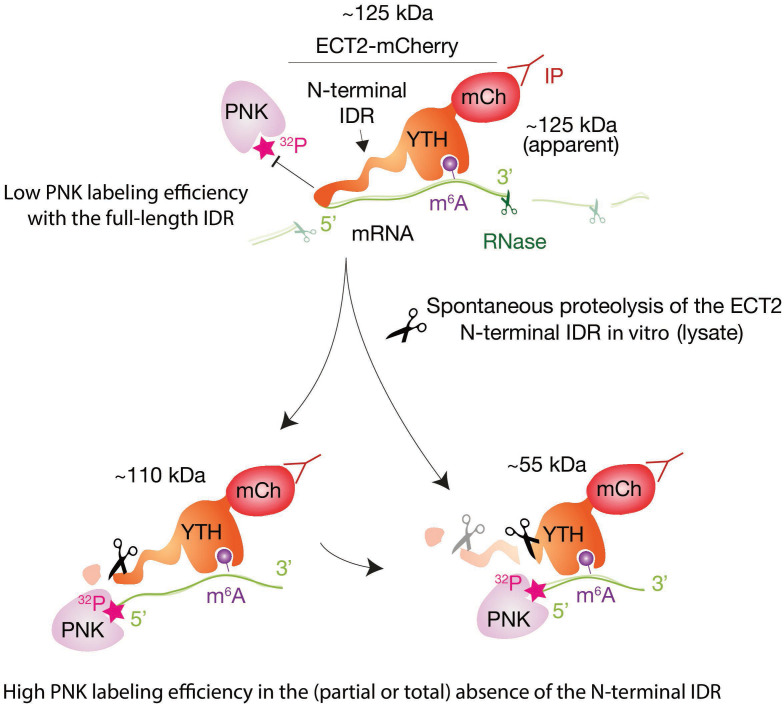
Figure 3—figure supplement 2. Illustration of RNA-binding properties of ECT2 revealed by CLIP.

Figure 3—figure supplement 2.

Interpretation of the pattern of labeled RNA in CLIP experiments due to the spontaneous proteolysis of the ECT2 intrinsically disordered region (IDR) in the lysate, and the different labeling efficiency of bound RNA: RNA co-migrating with the most abundant ECT2-mCherry fragment (full-length, ~125kDa) is barely labeled while the strongest signal appears at ~55kDa (the size of the YTH domain fused to mCherry), where protein abundance is below the western blot detection limit (Figure 3B and C). This observation suggests limited accessibility of 5′-ends of full length ECT2-bound RNA to polynucleotide kinase (PNK), likely due to binding to the IDR. Supporting this idea, the samples containing full-length protein (’110kDa band’) required fewer PCR cycles to obtain similar amounts of library DNA and generated more unique reads than their ‘55kDa band’ counterparts (Figure 3—figure supplements 3 and 4), indicating that most of the RNA co-purifies with full-length ECT2-mCherry, and the stronger intensity of the ‘55kDa band’ (Figure 3B) is indeed due to differences in labeling efficiency.
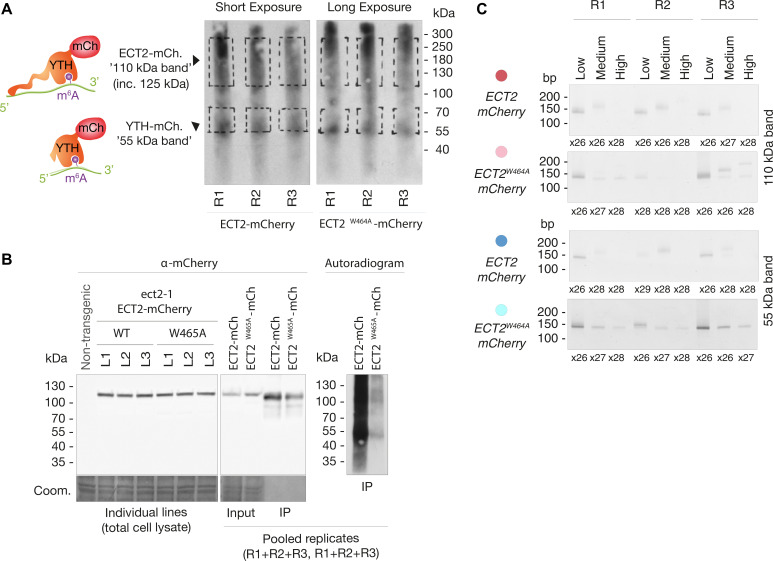
Figure 3—figure supplement 3. iCLIP Libraries.

Figure 3—figure supplement 3.

(A) Autoradiograms showing labeled RNA co-purified with ECT2-mCherry and ECT2W464A-mCherry in the replicates used to generate iCLIP libraries. Handwritten dashed lines on the films were used as guides to excise the corresponding membrane pieces (‘110 ’Da’ and ‘55kDa’ bands) with a scalpel. The apparently comparable amount of labeled RNA in the two panels, generated from two different membranes and gels run and blotted identically, but separately is a product of different exposure times, which were adjusted in each case for optimal visualization of the RNA. (B) Left panel: α-mCherry protein blot from cell extracts of the 3 + 3 independent lines used for iCLIP. Middle and right panels: α-mCherry protein blot and autoradiogram of the cell extracts (input) and the RFP-trap IPs used to prepare the iCLIP libraries. Because samples for ECT2-mCherry and ECT2W464A-mCherry samples were run in separate gels to prevent cross-contamination, pooled aliquots were saved to compare the extent of ECT2 degradation and RNA-binding between them. (C) PCR reactions (number of cycles is indicated) used to prepare iCLIP libraries. For each one of the four different libraries, the three corresponding PCRs (low, medium, and high molecular weight) were combined according to their relative concentrations to compensate for inequalities. Notice that the size of the cDNA-insert to be mapped to the genome is expected to be the size of the PCR product minus the length of the P3/P5 Solexa primers and the barcode (128 nt in total) (Huppertz et al., 2014). Therefore, the low molecular weight bands cut at [70–85]-nt on the cDNA gel, with [20–35]-nt-cDNA + 52-nt-primer, generate [145–155]-nt PCR fragments. The low amount of PCR product from the higher molecular weight bands is to be expected, and the non-matching PCR product sizes of the ECT2W464A-mCherry control samples are likely a product of the low amount of RNA co-purified with the m6A-binding-deficient ECT2 mutant.
Figure 3—figure supplement 3—source data 1. Uncropped labeled panels and raw image files: Figure 3—figure supplement 3A-C.
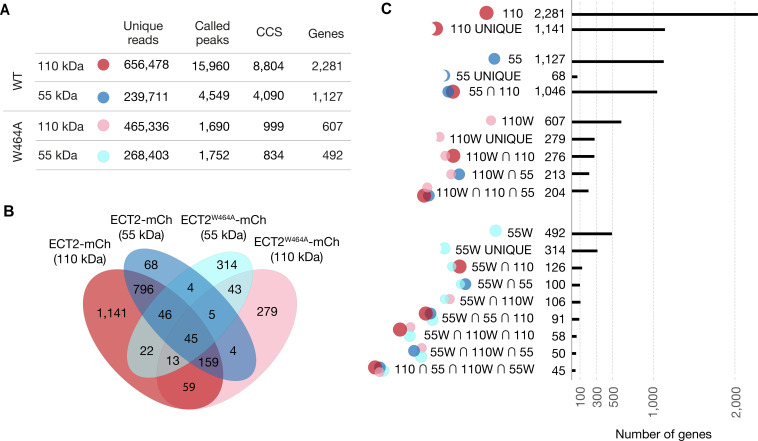
Figure 3—figure supplement 4. Analysis of ECT2 iCLIP Libraries.

Figure 3—figure supplement 4.

(A) Number of valid reads (trimmed reads mapped to the Arabidopsis genome [TAIR10] discarding PCR duplicates), called peaks ( = crosslink sites) (Krakau et al., 2017), collapsed crosslink sites (CCS) (peaks with the highest PureCLIP-score within clusters and extended by 4 nt in both directions forming 9 nt wide regions), and target genes, obtained from ECT2-mCherry iCLIP libraries. (B) Overlaps between gene sets identified for the four ECT2-mCherry iCLIP libraries generated in this study. (C) Upset plot displaying gene counts according to different sets defined from the four iCLIP libraries.