. 2021 Sep 30;10:e72375. doi: 10.7554/eLife.72375

Figure 5. ECT2 UV-crosslinks to uridines in the immediate vicinity of DR(m6A)CH or GG(m6A)U sites.

(A) Normalized density of sites at and up to +/-100 nt of either m6A-Nanopore*, m6A-miCLIP* or ECT2-iCLIP sites. (B) Proportion of m6A and ECT2-iCLIP sites at each nucleotide by the different methods. (C) View from IGV browser illustrating the presence of RRACH, GGAU and U-rich motifs in the vicinity of m6A and ECT2 sites in the 3’-UTR of AT1G23490 (ARF1). CS, crosslink sites; CSS, collapsed crosslink sites. (D) Key motifs analyzed in this study. From top to bottom: (1) motif logos for derived position weight matrices (PWMs); (2) normalized enrichment of motif locations across gene body; (3-4) total number of the relevant motif found at m6A-Nanopore* (3) or ECT2-iCLIP (4) sites according to gene body location. Gray lines indicate numbers found in a gene-body location-matched background set of sites of equivalent number; (5-6) distribution of the relevant motif relative to m6A-Nanopore* (5) or ECT2–iCLIP (6) sites. Gray lines represent the distribution for the same gene-body location-matched set as derived in the panels above. * Parker et al., 2020; ** Shen et al., 2016; *** Wei et al., 2018.

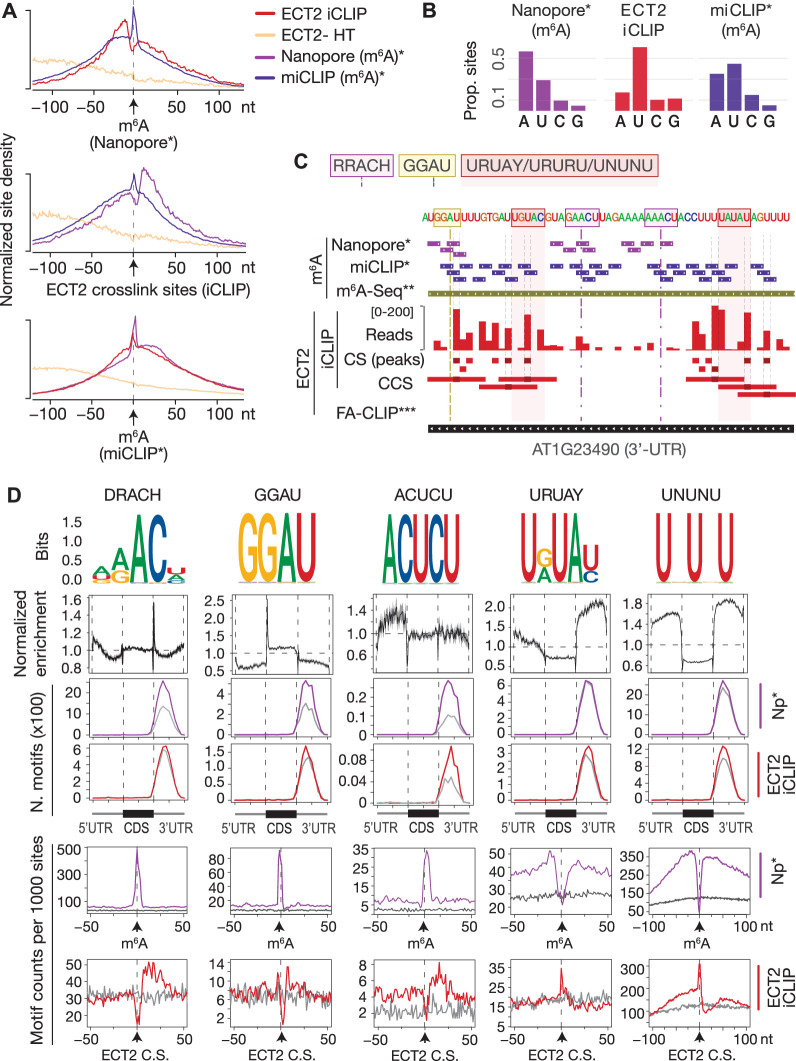
Figure 5.

Figure 5—figure supplement 1. Sources of motifs and generation of position weight matrices (PWMs).

Figure 5—figure supplement 1.

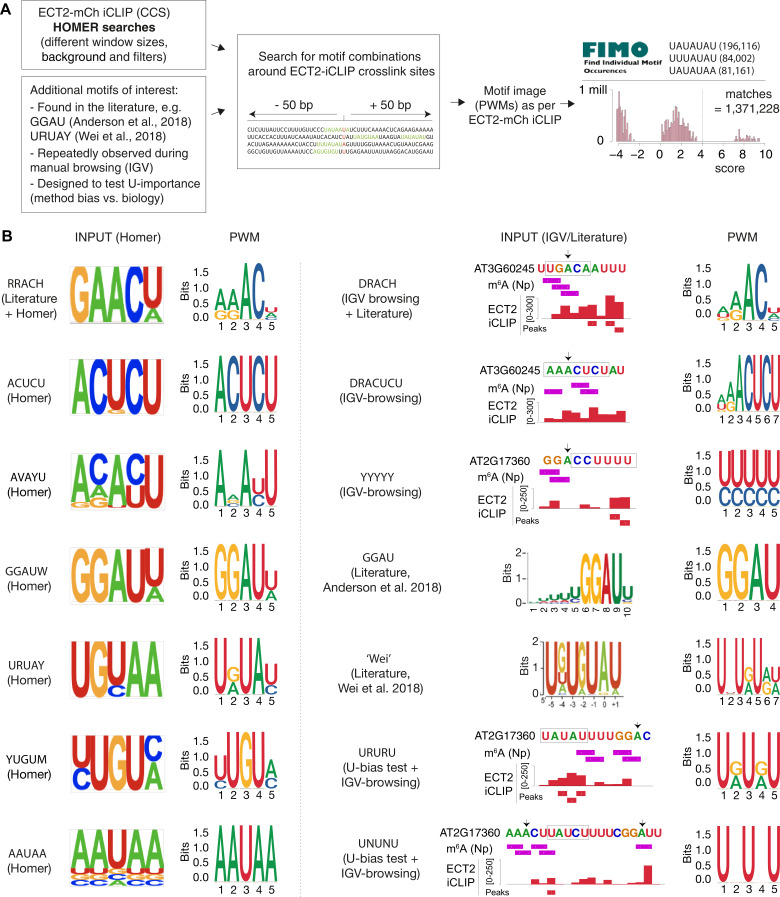
(A) Relative nucleotide frequencies for motifs of interest with potential sequence redundancies were estimated from windows around ECT2-iCLIP collapsed crosslink sites (CCS) and converted into PWMs that were subsequently used in FIMO to scan for motif matches genome wide. Plot illustrates score distribution for the motif derived from Wei et al., 2018, and vertical dotted line indicates chosen score cutoff. (B) Subset of motifs according to source. Left: examples of motifs inspired by Homer searches (left logo) and subsequent PWM used in the analysis (right logo). Right: examples of further motifs derived from other sources. Logo from the relevant paper is shown if the motif derives from literature, and representative examples of IGV-browser screenshots are shown otherwise (motifs are outlined; arrows mark As within DRACH/GGAU contexts; Np, Nanopore [Parker et al., 2020]). Subsequent PWMs are also indicated (right logos).
Figure 5—figure supplement 2. Motif logos generated from position weight matrices.

Figure 5—figure supplement 2.

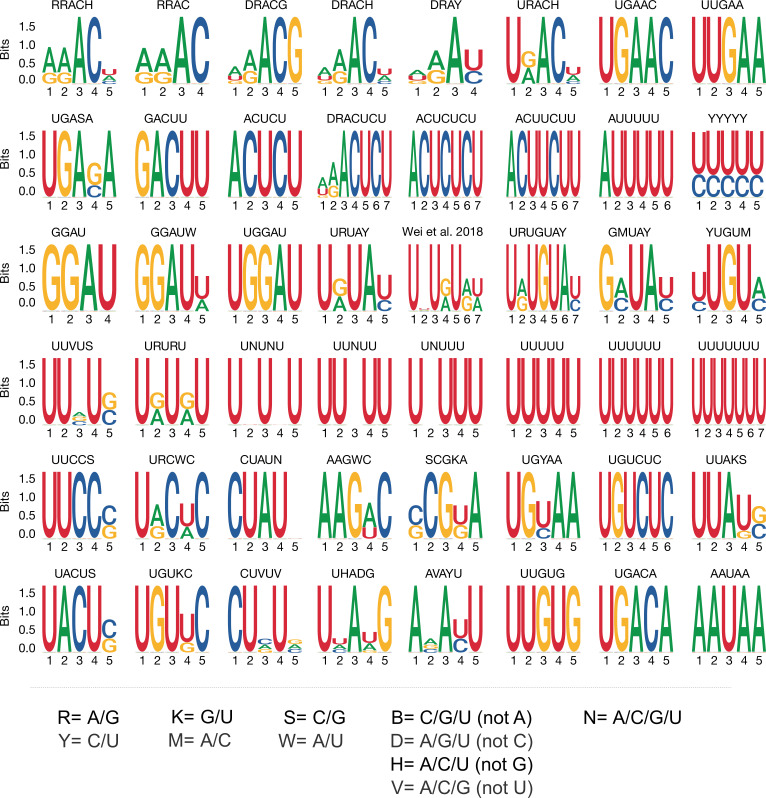
Motif logos represent all of the 48 derived motif position weight matrices considered in the current analysis (see Materials and methods and Figure 5—figure supplement 1 for selection details). UPAC-IUB codes to define multiple nucleotide possibilities in one position are detailed below.
Figure 5—figure supplement 3. Enrichment of RRACH variants around m6A and ECT2 sites.

Figure 5—figure supplement 3.

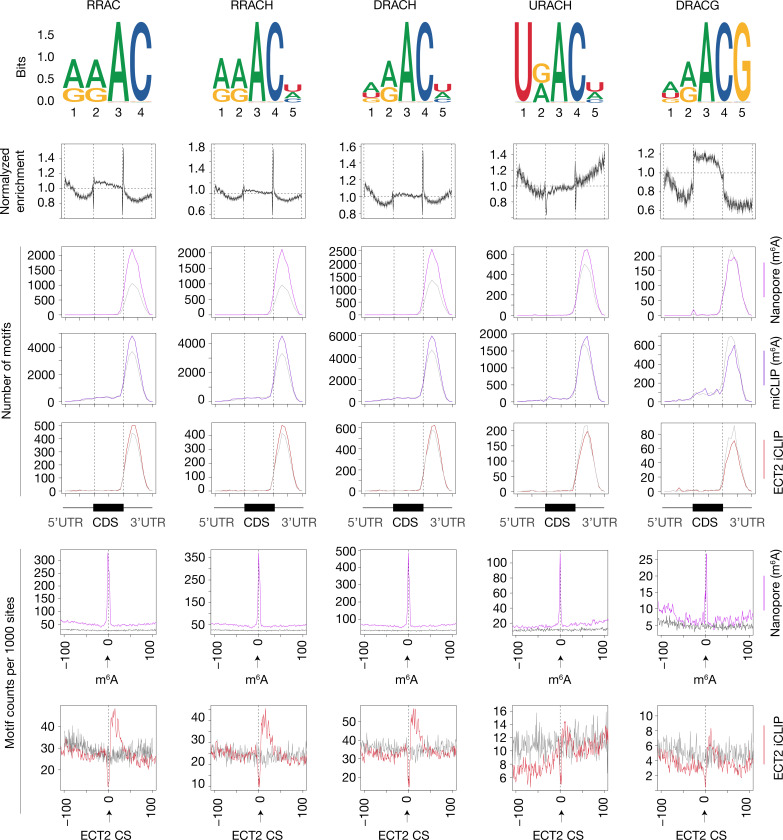
From top to bottom: (1) motif logos for derived position weight matrices (PWMs); (2) normalized enrichment of motif locations across gene body; (3–5) total number of the relevant motif found at m6A-Nanopore* (3), m6A-miCLIP*, (4) or ECT2-iCLIP (5) sites according to gene body location. Gray lines indicate numbers found in a gene body location-matched background set of sites of equivalent number; (6 and 7) distribution of the relevant motif relative to m6A-Nanopore* (6) or ECT2–iCLIP (7) sites. Gray lines represent the distribution for the same gene body location-matched set as derived in the panels above. RRACH shows a slightly higher enrichment over RRAC around m6A-Nanopore* sites, which is further increased in the more lenient version DRACH. Accordingly, there is also clear enrichment of URAC. On the contrary, there is no global enrichment of DRACG in m6A-Nanopore* datasets along the gene body, and only very modest around m6A-Nanopore* sites, highlighting the importance of the final H in DRACH. R = A/G, H = A/C/U, D = A/G/U. * Parker et al., 2020.
Figure 5—figure supplement 4. Uridines flanking DRACH result in additional motifs enriched at ECT2 iCLIP sites.

Figure 5—figure supplement 4.

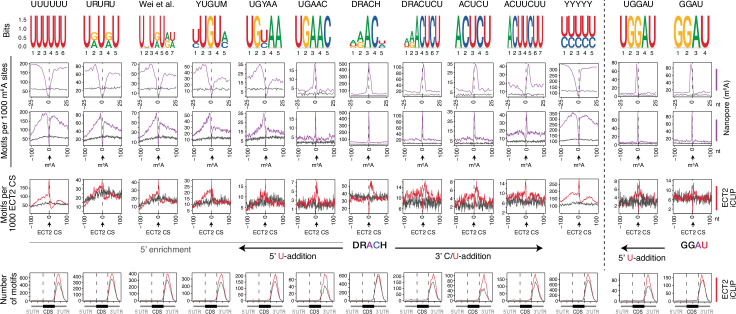
Enrichment of DRACH-like motifs containing additive amounts of U(/Y)s at the flanks until there is only U/Ys. Through the upstream U-additions, transition forms like URURU/UGUAY/YUGUM are included. GGAU with addition of one U upstream is also shown on the right side of the figure. From top panel to bottom: (1) motif logos for derived position weight matrices (PWMs); (2-4) distribution of the relevant motif relative to m6A-Nanopore (Parker et al., 2020) (2, 3) or ECT2–iCLIP crosslink sites (CS) (4). Gray lines represent the distribution for gene body location-matched background set of sites of equivalent number; (5) total number of the relevant motif found at ECT2-iCLIP sites according to gene body location. Gray lines indicate numbers found in the same gene body location-matched background set.
Figure 5—figure supplement 4—source data 1. High quality image file.