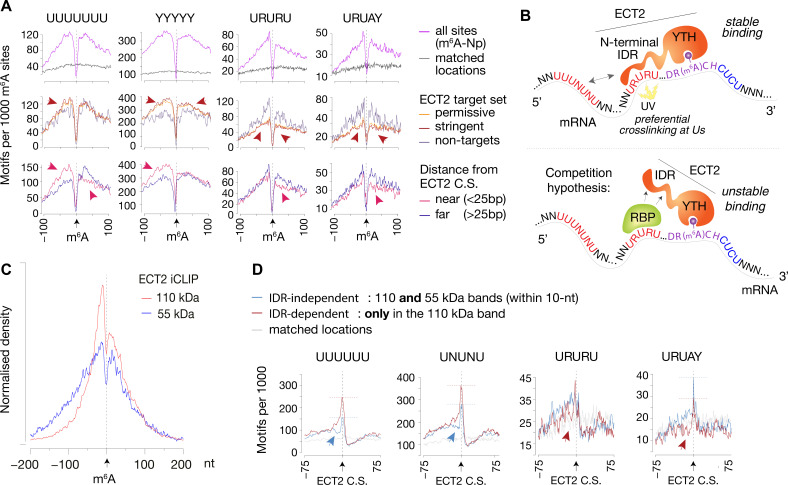
Figure 7. IDR-dependent binding of ECT2 to U-rich motifs 5’ of m6A.
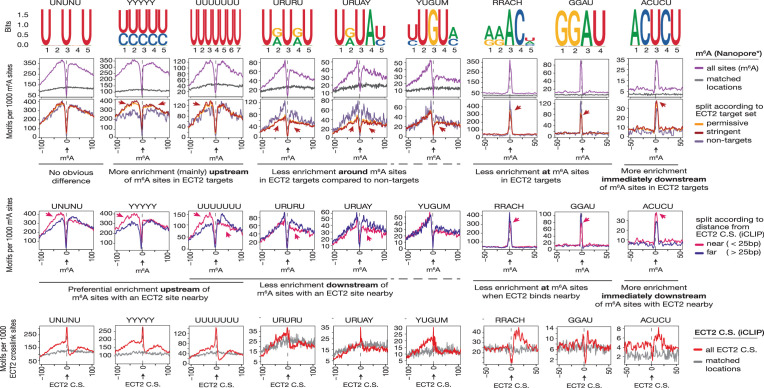
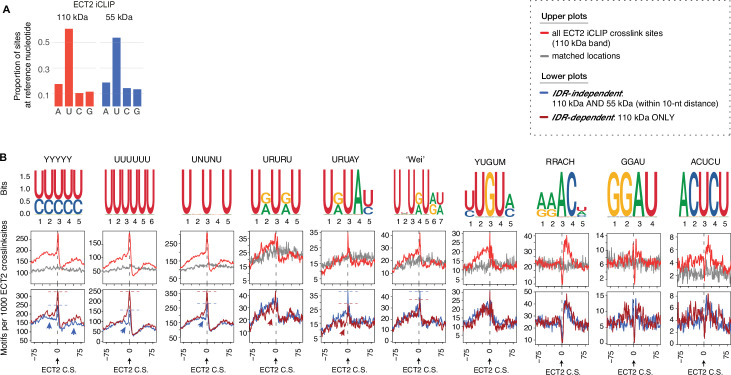
(A) Top panels: Distance-based enrichment of motifs at and around m6A-Nanopore (Np, Parker et al., 2020) sites, plotted as motif counts per 1000 m6A sites (purple lines). Gray lines indicate the enrichment in a location-matched background set as in Figure 5D. Middle and bottom panels: sites are split according to whether they sit on ECT2 targets (middle), or to distance from the nearest ECT2 crosslink site (for ECT2-iCLIP targets only) (bottom). Additional motifs are shown in the Figure 7—figure supplement 1. (B) Cartoon illustrating the ECT2 IDR RNA-binding and competition hypotheses. (C) Normalized density of ECT2 iCLIP crosslink sites identified in the libraries corresponding to the 110- and 55-kDa bands (Figure 3B) at and up to +/-200 nt of m6A-Nanopore sites. (D) Motifs per 1000 ECT2-iCLIP crosslink sites (CS) split according to whether they are found in libraries from both 110-kDa and 55-kDa bands (IDR-independent’), or exclusively (distance > 10 nt) in the 110-kDa band (’IDR-dependent’). Gray lines indicate the enrichment in a location-matched background set as in Figure 5D. Additional motifs are shown in Figure 7—figure supplement 2 and Supplementary file 3.


