
Figure 3.
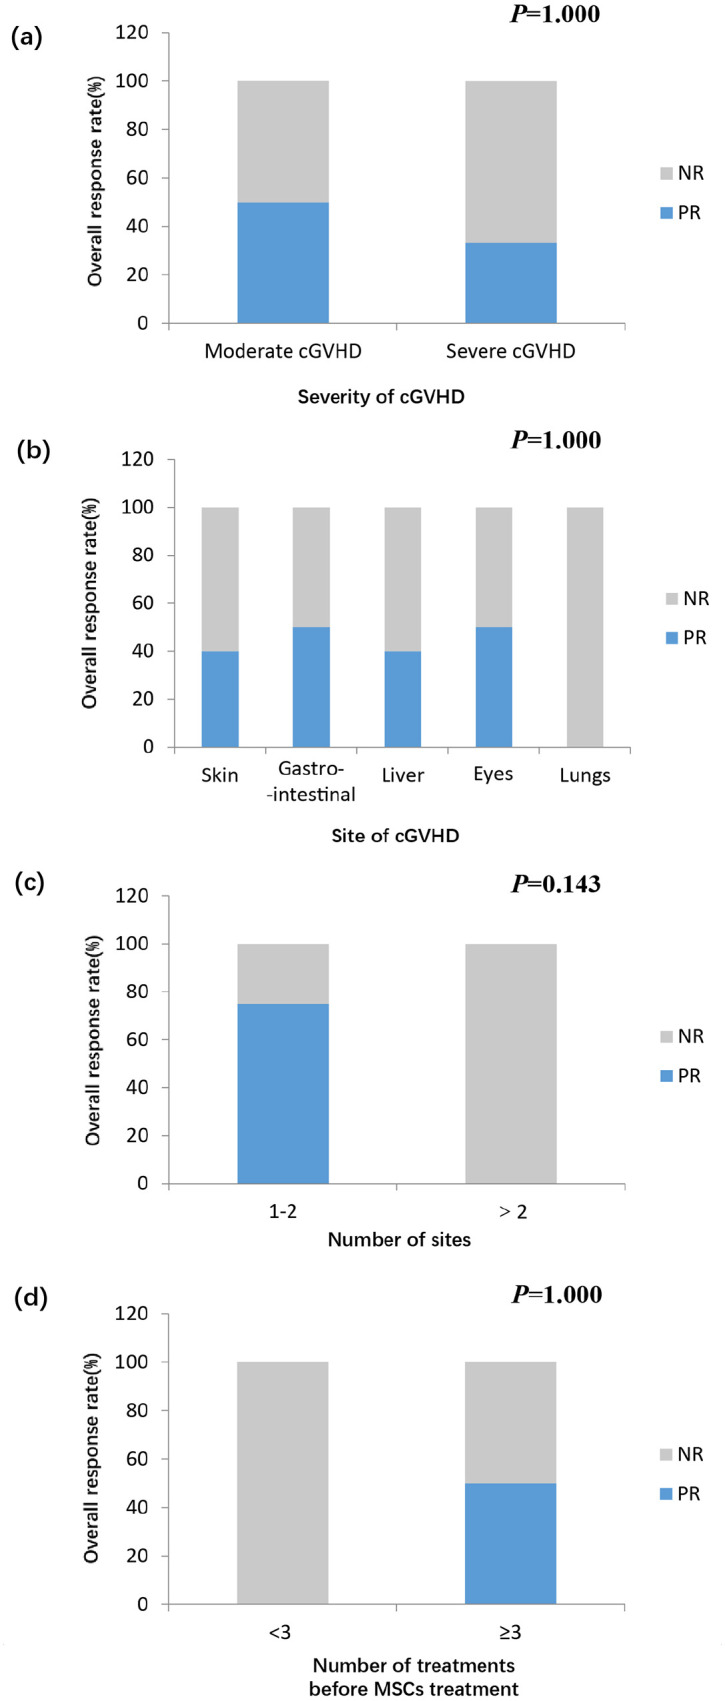
Response rate of MDR-cGVHD patients after MSCs treatment. Patients are grouped by (a) severity of cGVHD; (b) site of cGVHD; (c) number of involved sites; and (d) number of treatments before MSCs treatment.
Official websites use .gov
A
.gov website belongs to an official
government organization in the United States.
Secure .gov websites use HTTPS
A lock (
) or https:// means you've safely
connected to the .gov website. Share sensitive
information only on official, secure websites.
Response rate of MDR-cGVHD patients after MSCs treatment. Patients are grouped by (a) severity of cGVHD; (b) site of cGVHD; (c) number of involved sites; and (d) number of treatments before MSCs treatment.