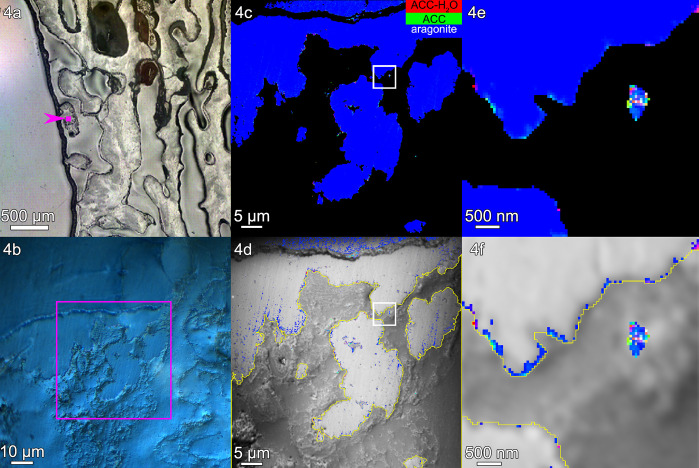
Figure 4.
Turbinaria peltata: (a) PLM image, (b) Differential Interference Contrast (DIC) image, (c) component map, and (d) average PEEM image overlaid with the component map, as described in Figure 2. (e, f) The regions boxed in panels c and d are magnified here to show amorphous particles where calicoblastic cells are expected. Amorphous pixels also appear along the edge of the skeleton. Extraskeletal particles are mostly amorphous within the calicoblastic epithelium, <2 μm outside the yellow line in panels d and f. Intraskeletal amorphous pixels in panel f extend <1 μm inside the yellow line. See Figure S4 for more images of this area.

