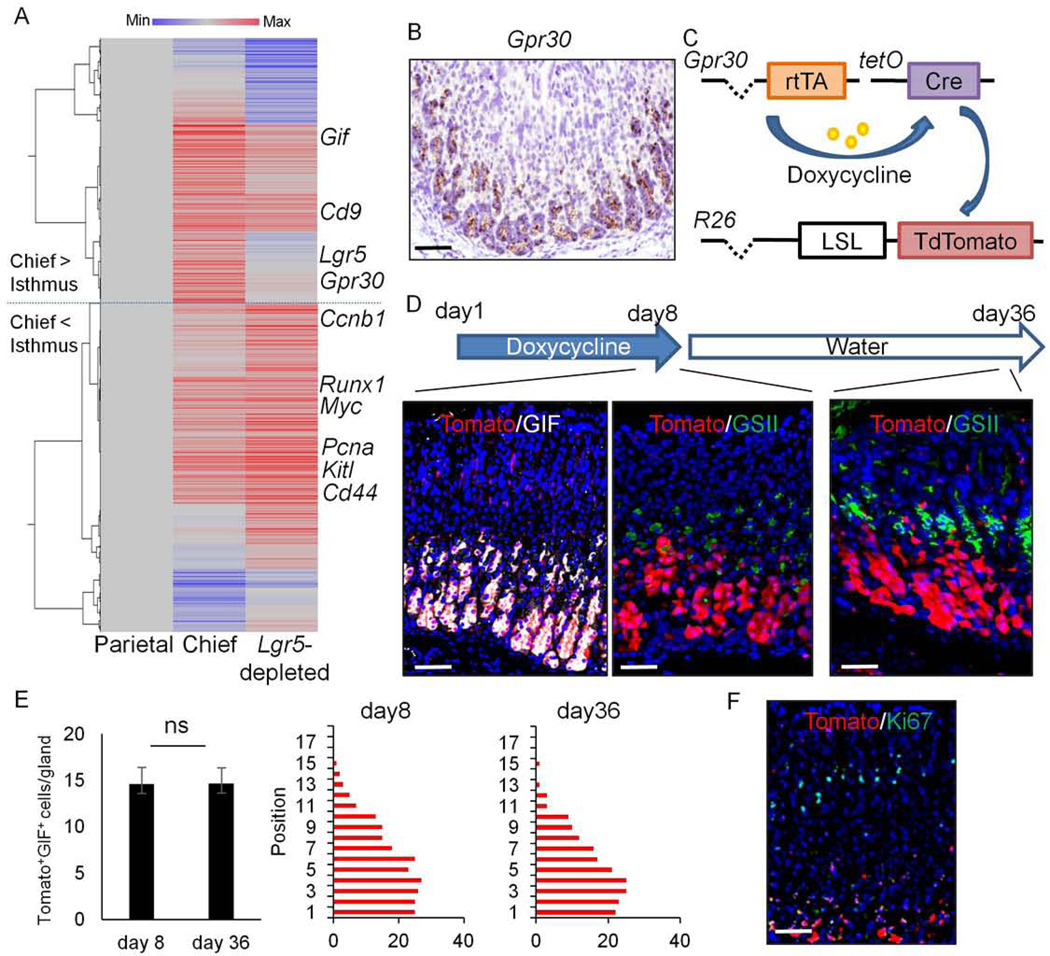
Figure 1.

Gpr30 is specifically expressed in gastric chief lineage.
(A)Hierarchical clustering of average gene expression in Mist1+ chief cell-enriched group (Chief)and Lgr5-depleted, Mist1+ isthmus cell-enriched group (Lgr5-depleted) compared to parietal cell group (n=3/group). (B) ISH of Gpr30(brown) in the mouse corpus. (C-D)Schema (C) and protocol (D, top) of Gpr30-rtTA;TetO-Cre;R26-TdTomato mice treatment. Immunostainings at the indicated time points are shown (Tomato(red) and GIF(gray) at the left, Tomato(red) and GSII(green) at the middle and right). (E)Numbers of Tomato+GIF+ cells (left) and cell position (right) at day 8 and 36. Total 30 glands were quantified in each panel. Mean±SEM. (F)Immunostaining of Ki67(green) and Tomato(red) on Gpr30-rtTA;TetO-Cre;R26-TdTomato mice at day 8. Bars=50μm.
