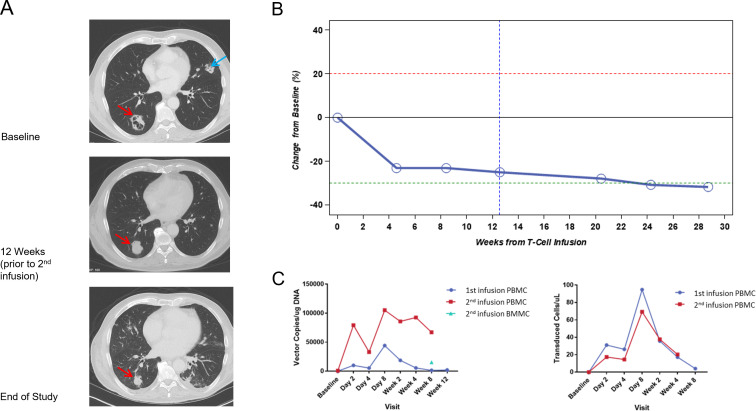
Figure 1.
Patient 9: Response to treatment and persistence of ADP-A2M10. (A) CT scans of the RLL (red arrow) and LUL lung masses (blue arrow) at baseline (prior to the first infusion of ADP-A2M10, during week 12 (3 weeks prior to the second infusion of ADP-A2M10), and at the end of study (~28 and ~13 weeks from the first and second ADP-A2M10 infusions, respectively). (B) Graphical representation of the response by RECIST V.1.1. The patient’s baseline response for the second infusion used the week 12 tumor assessment from the first infusion of ADP-A2M10, as target and non-target lesions were the same as the first infusion. Percentage change in the sum of diameters is calculated on the basis of the baseline measurement from the first infusion. The blue dotted line signifies the baseline for the second infusion. (C) Persistence assessed as vector copies/microgram DNA (left panel) and as ADP-A2M10/microliter (right panel) for samples where absolute cell count data were available. BBMC, bone marrow mononuclear cells; LUL, left upper lobe; PBMC, peripheral blood mononuclear cells; RLL, right lower lobe.

