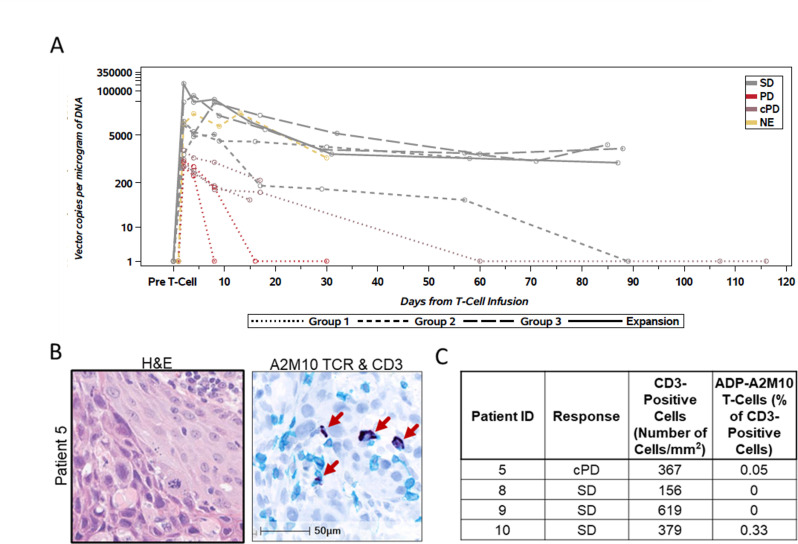
Figure 2.
ADP-A2M10 was detected in peripheral blood and tumor tissue after the first infusion. (A) Persistence of ADP-A2M10 was measured by quantitative PCR of the Psi element sequence in genomic DNA extracted from peripheral blood mononuclear cells. Dotted, dashed, broken, and solid lines indicate dose group (0.08–0.12×10⁹, group 1; 0.5–1.2×10⁹, group 2; and 1.2–15×109, dose group 3/expansion). In addition, data points are colored by response based on RECIST V.1.1 except for three patients who had clinical progression by investigator assessment. (B) Representative field of (left) H&E stain and (right) CD3 IHC/ADP-A2M10 TCR RNAish duplex stain performed for the detection of CD3+ and/or ADP-A2M10 TCR+ cells in the tumor tissue of patient 5 collected within 8 weeks after infusion. In the right image, CD3+ cells are shown in teal, ADP-A2M10 TCR+ cells are shown in dark blue, and nuclei are shown in light blue (hematoxylin stain). (C) Result table for CD3 IHC/RNAish duplex assays reporting the detection of ADP-A2M10 in two of four postinfusion tumor samples. cPD, clinical PD; IHC, immunohistochemistry; NE, not evaluable; PD, progressive disease; RECIST V.1.1, Response Evaluation Criteria in Solid Tumors V.1.1; RNAish, RNA in situ hybridization; SD, stable disease; TCR, T-cell receptor.

