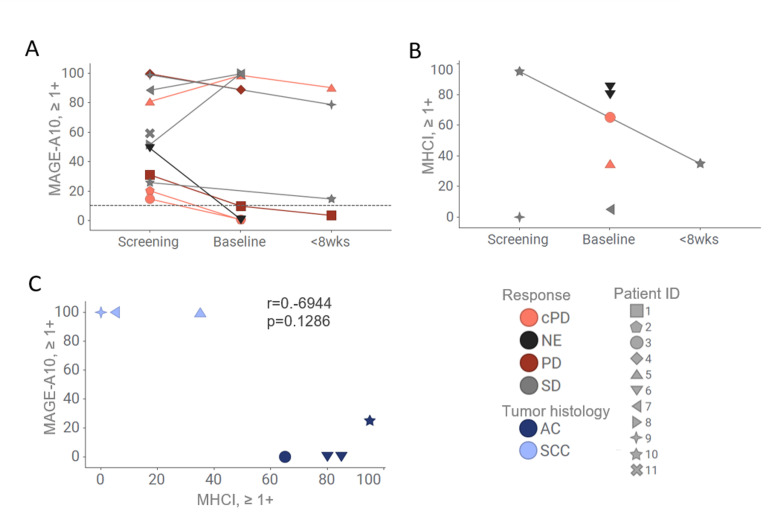
Figure 3.
Variability of MAGE-A10 and MHCI expression in tumor cells across the trial patients. Preinfusion biopsies (screening and baseline) (A–C) and postinfusion biopsies collected within 8 weeks after the first infusion of ADP-A2M10 (A, B) were used for MAGE-A10 expression and MHCI expression evaluation. (A, C) MAGE-A10 expression was assessed by MAGE-A10 IHC and plotted as percentage of tumor cells with 1+, 2+, and 3+ intensities. (A) Horizontal lines designate the cut-off of 10% of tumor with ≥1+ intensity of staining. (B, C) MHCI expression was assessed using MHCI IHC assay and plotted as percentage of tumor cells with 1+, 2+, and 3+ intensities. Data points are colored by response (A, B) or by tumor histology (C). Patient IDs are indicated by shape. AC, adenocarcinoma; cPD, clinical PD; ID, identifier; IHC, immunohistochemistry; MAGE-A10, melanoma-associated antigen A10; MHCI, major histocompatibility complex I; NE, not evaluable; PD, progressive disease; SCC, squamous cell carcinoma; SD, stable disease; wks, weeks.

