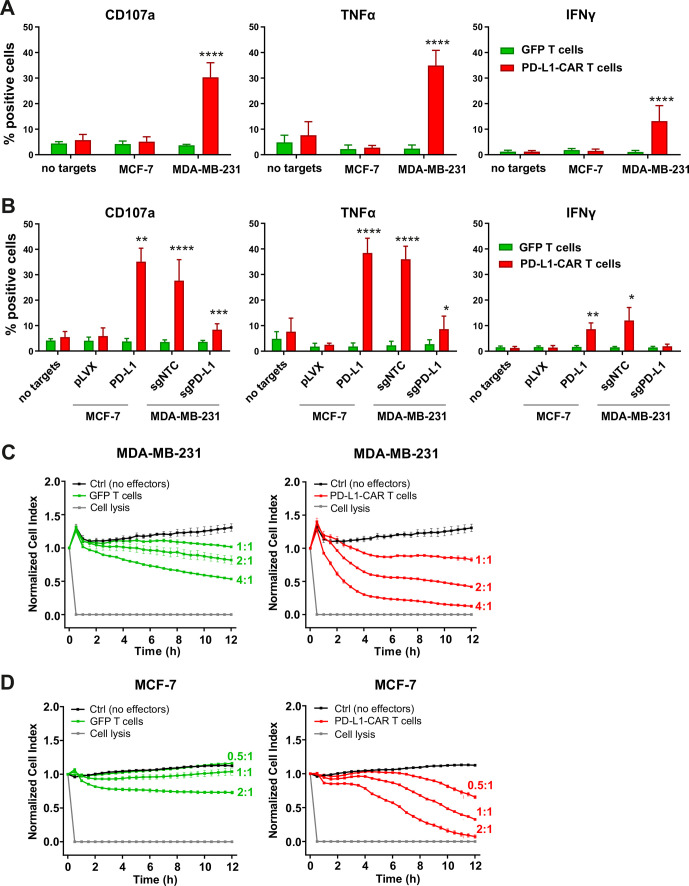
Figure 3.
Cytokine production and degranulation by PD-L1–CAR T cells following stimulation with breast cancer cells. (A) Functional and cytokine release assays of PD-L1–CAR T cells targeted against MCF-7 (PD-L1low/−) or MDA-MB-231 (PD-L1+) cancer cell lines. Degranulation assay, assessed by CD107a staining (left panel), TNFα release (middle panel), and IFNγ release (right panel) were measured after 4 hours of coincubation of target and effector cells at the E:T ratio of 2:1. The experiment was repeated in duplicates three times. Bars represent the mean value±SD. The normality was checked using the Shapiro-Wilk test. The p values derived from unpaired t-test: ****p<0.0001. (B) Functional and cytokine release assays of PD-L1–CAR T cells targeted against MCF-7 pLVX (PD-L1low/−) and MCF-7 PD-L1 and MDA-MB-231 sgNTC (PD-L1+) or MDA-MB-231 sgPD-L1 (PD-L1-) cancer cell lines were assessed by flow cytometry. Degranulation assay, assessed by CD107a staining (left panel), and IFNγ release (right panel) were measured after 4 hours of coincubation of target and effector cells at the E:T ratio of 2:1. The experiment was repeated in duplicate three times (for IFNγ release by MCF-7 for two times). Bars represent the mean value±SD The p values derived from unpaired t-test or Mann-Whitney test depending on data distribution (*p<0.05, **p<0.01, ***p<0.001, ****p<0.0001). (C) The potential of killing tumor cells by control (pSEW-GFP) and PD-L1–CAR T cells was measured by impedance analysis for MDA-MB-231 cells. Cancer cell lines were left to adhere and form a monolayer on the E plates for 24 hours. The next day, PD-L1–CAR T cells or control (pSEW-GFP) T cells were added to the monolayers for 12 hours at the indicated E:T ratios. Representative mean impedance curves from two wells were shown. The experiment was repeated in duplicates two times. (D) The potential of killing tumor cells by control (pSEW-GFP) and PD-L1–CAR T cells was measured by impedance analysis for MCF7 cells. Cancer cell lines were left to adhere and form a monolayer on the E plates for 24 hours. The next day, PD-L1–CAR T cells or control (pSEW-GFP) T cells were added to the monolayers for 12 hours at the indicated E:T ratios. Representative mean impedance curves from two wells were shown. The experiment was repeated in duplicates two times. CAR, chimeric antigen receptor, PD-L1 - programmed death-ligand 1, TNFα - tumor necrosis factor α, IFNγ - interferon γ, GFP - green fluorescent protein, SSC - side scatter

