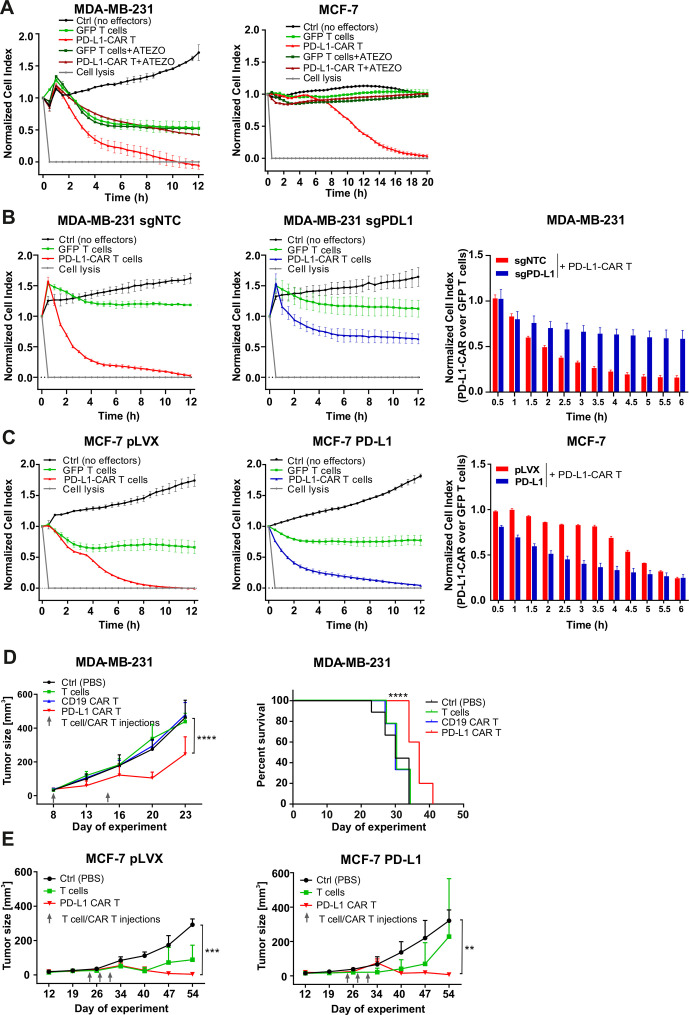
Figure 4.
The efficacy of PD-L1–CAR T cells against breast cancer cells with different PD-L1 protein expression. (A) The killing potential of PD-L1–CAR T cells against MDA-MB-231 (left panel) or MCF-7 (right panel) breast cancer cells was measured by impedance analysis. Cancer cell lines were seeded on the E plates and left to adhere and form a monolayer for 24 hours. The next day, PD-L1–CAR T cells or control (pSEW-GFP) T cells were added to the monolayers at the E:T ratio of 2:1 (MDA-MB-231) and 1:1 (MCF-7) in the absence or presence of 0.4 mg/mL atezolizumab. The cultures were monitored for the next 12 hours. Representative mean impedance curves from two wells are shown. The experiment was repeated in duplicates three times. (B) The cytotoxic activity of PD-L1–CAR T cells against MDA-MB-231 sgNTC (left panel) and MDA-MB-231 sgPD-L1 (middle panel) cancer cell lines, at the E:T ratio of 2:1, were measured by impedance analysis. Samples were internally normalized for the cell index value measured before CAR T cells addition (Normalized Cell Index plots). Bar graph represents Normalized Cell Index values of quantification of PD-L1–CAR T-cell killing over GFP T cells control from 0.5 to 6 hours (right panel). Representative average impedance curves from two wells are shown. The experiment was repeated in duplicates two times. (C) Cytotoxic activity of PD-L1–CAR T cells against MCF-7 pLVX (left panel) and MCF-7 PD-L1 (middle panel) cancer cell lines at the E:T ratio of 1:1 were measured by impedance analysis. Samples were internally normalized for the cell index value measured before PD-L1–CAR T cells addition (Normalized Cell Index plots). Bar graph represents Normalized Cell Index values of quantification of PD-L1–CAR T-cell killing over GFP T cells control from 0.5 to 6 hours (right panel). Representative average impedance curves from two wells are shown. The experiment was repeated in duplicates two times. (D) Mean volume of MDA-MB-231 tumors after two rounds (days 8 and 15) of intratumoral administration of PBS (control), unmodified T cells, CD19–CAR or PD-L1–CAR T cells, +SD, two-way ANOVA test, ****p<0.0001, left panel. Corresponding Kaplan-Meier survival plot, analyzed by log-rank survival test, ****p<0.0001, right panel. The graphs present results summarized from two independent experiments, n=9–10. (E) Mean tumor size of MCF-7 pLVX (left panel, n=6–7) and MCF-7 PD-L1 (right panel, n=4–6). Mice were treated with PBS (control), unmodified T cells, or PD-L1–CAR T cells on days 24, 27, and 30, +SD, two-way ANOVA test, **p<0.01, ***p<0.001. CAR, chimeric antigen receptor, PD-L1, programmed death-ligand 1, PBS, phosphate-buffered saline, ANOVA - analysis of variance, GFP - green fluorescent protein.

