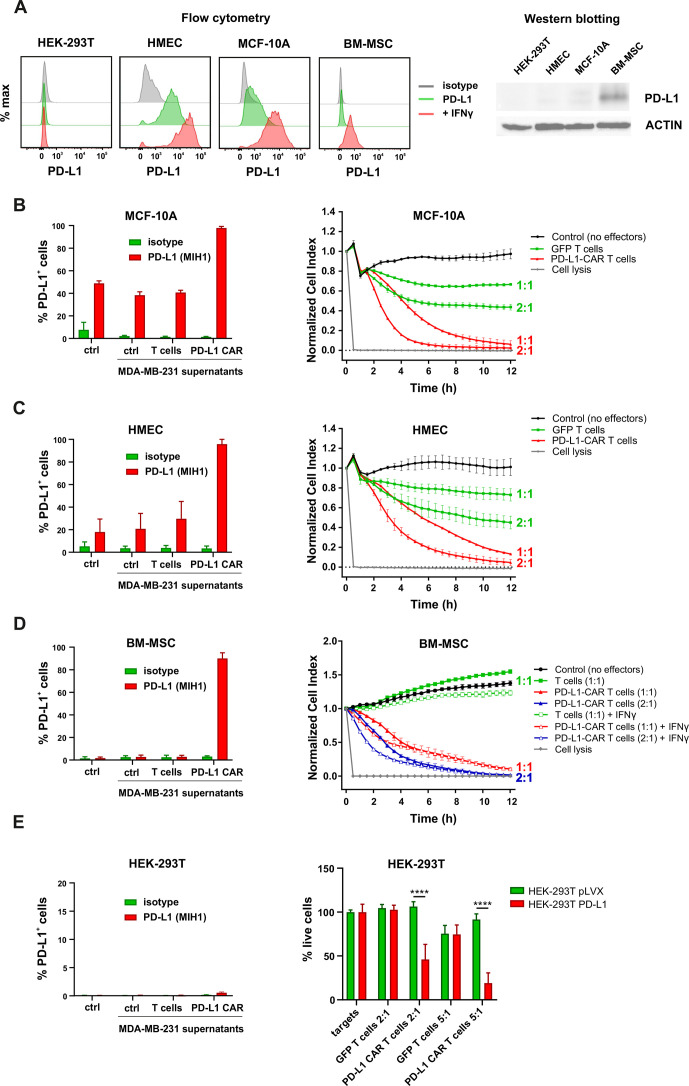
Figure 6.
Expression of PD-L1 and PD-L1–CAR T mediated cytotoxicity in non-malignant cells. (A) IFNγ induced expression of PD-L1 on HEK293T cell line derived from human embryonic kidney cells and non-malignant cells (HMEC, MCF-10A, and bone marrow-derived mesenchymal stem cells (BM-MSC)) assessed by flow cytometry as presented on the left panel. PD-L1 staining was performed using anti-PD-L1 antibody (clone MIH1). The representative western blot analysis of PD-L1 expression in human embryonic kidney HEK293T cells and non-malignant mammary epithelial HMEC and MCF10A cells, and BM-MSC (right panel). β-actin was used as a loading control. The experiment was repeated three times. (B) PD-L1 expression induced on MCF-10A cells by activated CAR T cells (left panel) and RTCA-monitored cytotoxic activity of PD-L1 CAR T cells toward MCF-10A cells (right panel). The control (only medium) and conditioned supernatants from the 24 hours coincubation cultures in the presence of control (unmodified) T cells or PD-L1–CAR T cells with the target MDA-MB-231 cells were transferred onto the cultures of MCF-10A cell line and incubated for 48 hours. Next, PD-L1 surface presence was assessed by flow cytometry using anti-PD-L1 antibody (clone MIH1). Cytotoxic activity of PD-L1–CAR T cells against MCF-10A non-malignant cell line was measured by impedance analysis at the E:T ratios of 1:1 and 2:1. Samples were internally normalized for the cell index value measured before PD-L1–CAR T cells addition (Normalized Cell Index plots). The experiment was performed in duplicates three times. (C) PD-L1 expression induced on HMEC cells by activated CAR T cells (left panel) and RTCA-monitored cytotoxic activity of PD-L1 CAR T cells toward HMEC cells (right panel) was performed as described for (B). (D) PD-L1 expression induced on BM-MSC cells by activated CAR T cells (left panel) and cytotoxic activity of PD-L1–CAR T cells against BM-MSCs in the absence or presence of 25 ng/mL IFNγ was measured by impedance analysis at the E:T ratios of 1:1 and 2:1 (right panel). The experiment was performed in duplicates at least two times. (E) PD-L1 expression induced on HEK-293T cells by activated CAR T cells (left panel) and the killing potential of control (GFP-modified T cells) and PD-L1–CAR T cells against non-malignant human embryonic kidney cells HEK-293T pLVX (PD-L1low/null) and HEK-293T PD-L1 (PD-L1+) was determined by luciferase‐based killing assay following coculture of target and effector cells for 18 hours at different E:T ratios (right panel). The assay was repeated twice in triplicate and the results shown are representative of one experiment. CAR, chimeric antigen receptor; HMEC, human mammary epithelial cells, PD-L1, programmed death-ligand 1, IFNγ, interferon γ, GFP, green fluorescent protein, RTCA, real-time cell analysis.

