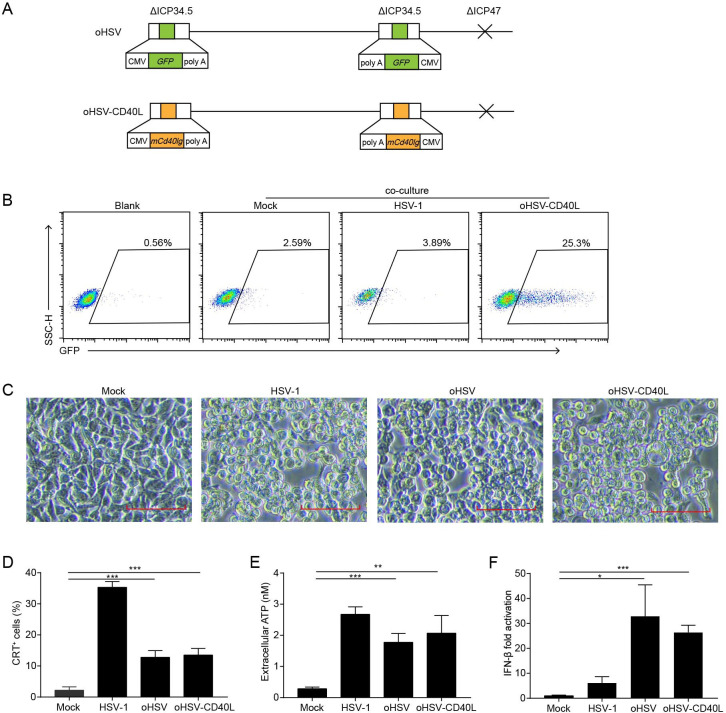
Figure 2.
The construction and cytolytic effects of oHSV-CD40L. (A) Schematic representations of oHSV and oHSV-CD40L genomes. For oHSV (upper row), both ICP34.5 loci were replaced with GFP-coding sequences, and the ICP47 gene region was deleted. oHSV-CD40L (lower row) was derived from oHSV by replacing the GFP sites with murine CD40L-encoding sequence. (B) Pan02_HVEM cells were mock-infected or infected with HSV-1 or oHSV-CD40L, and co-cultured with Jurkat/NF-κB-GFP-CD40 reporter cells as described in the ‘Materials and methods’ section. These cells were then subjected to flow cytometry analysis. The histograms were shown with fluorescence intensity of GFP as the horizontal axis. The reporter cells that were not co-cultured with Pan02_HVEM cells were designated as blank. The percentage of GFP-positive cells was labeled inside. (C) Pan02_HVEM cells were mock-infected or infected with wild-type HSV-1, oHSV, or oHSV-CD40L (MOI=5), respectively, and the cytopathic effects were monitored under microscopy at 24 hpi. Scale bar denotes 100 μm. (D) Pan02_HVEM cells were mock-infected or infected with wild-type HSV-1, oHSV, or oHSV-CD40L (MOI=1) for 24 hours, respectively. Cells were then stained with calreticulin (CRT) antibody for flow cytometry and the percentages of CRT+ cells were plotted in columns. The media were harvested, and the levels of released ATP were determined and plotted in E. (F) Total mRNA was isolated from cells infected as indicated, and IFN-β mRNA was quantitated by real-time quantitative PCR and plotted as a ratio relative to that of β-actin. Data were representative of three independent experiments. All values were presented as mean±SD. Statistics were performed using two-tailed Student’s t-test (D–F). *p<0.05; **p<0.01; ***p<0.001. hpi, hours post infection; IFN, interferon; MOI, multiplicity of infection; oHSV, oncolytic herpes simplex virus-1.

