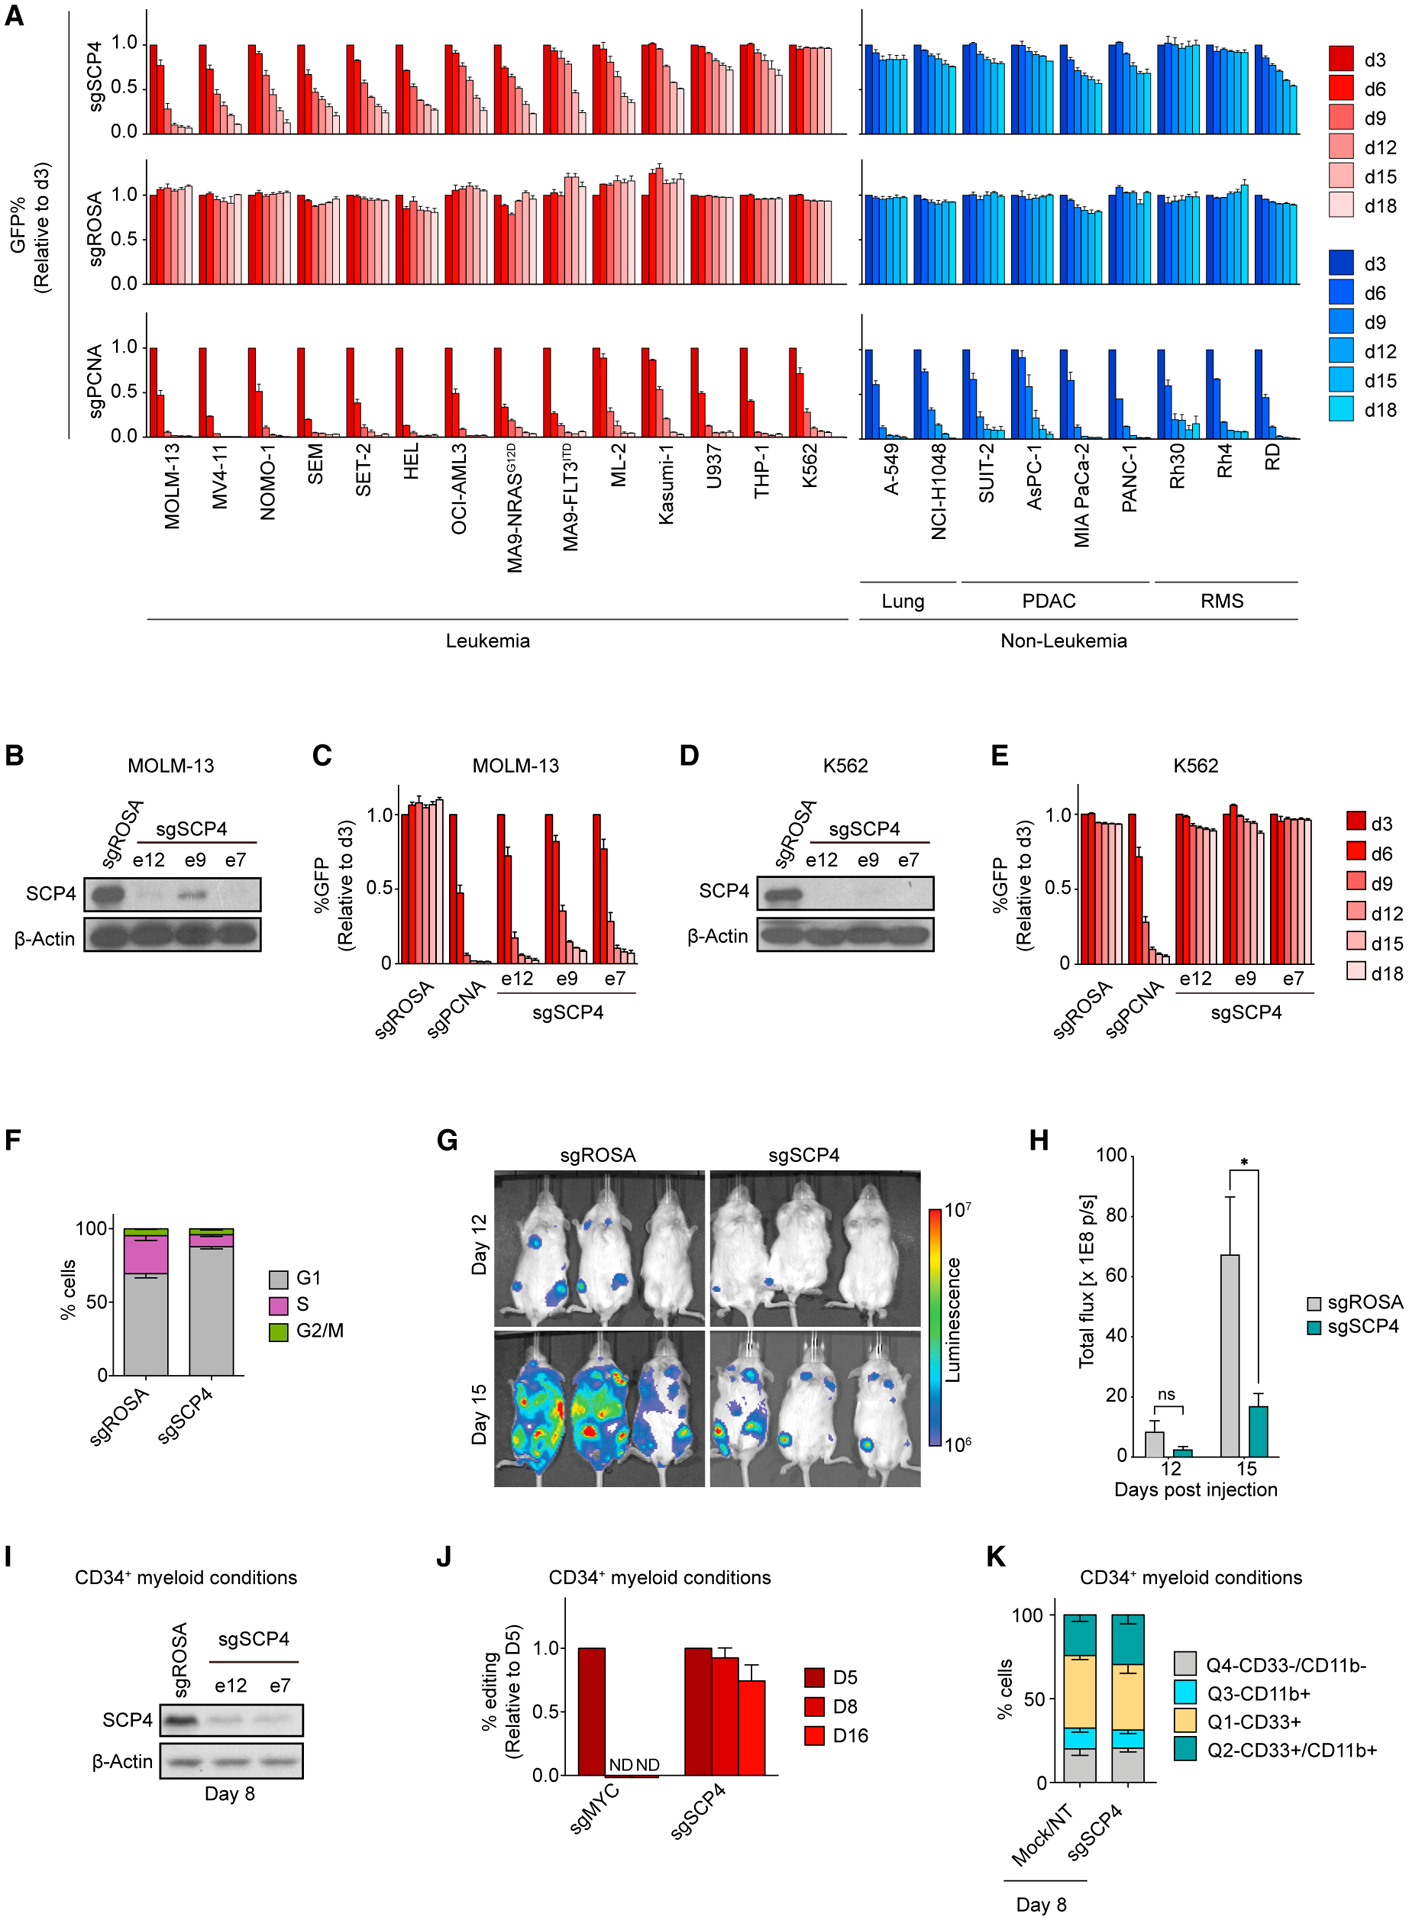
Figure 2. SCP4 is an acquired dependency in human AML.

(A) Competition-based proliferation assays in 23 human cancer cell lines infected with the indicated sgRNAs. PDAC, pancreatic ductal adenocarcinoma; RMS, rhabdomyosarcoma. n = 3.
(B) Western blot of whole-cell lysates from MOLM-13 cells on day 5 post-infection with the indicated sgRNAs.
(C) Competition-based proliferation assay in MOLM-13 cells infected with the indicated sgRNAs. n = 3.
(D) Western blot of whole-cell lysates from K562 cells on day 5 post-infection with the indicated sgRNAs.
(E) Competition-based proliferation assay in K562 cells infected with the indicated sgRNAs. n = 3.
(F) Quantification of the different cell-cycle stages in MOLM-13 cells on day 5 post-infection with the indicated sgRNAs. n = 3.
(G) Bioluminescence imaging of NSG mice transplanted with luciferase+/Cas9+ MOLM-13 cells infected with either sgROSA or sgSCP4.
(H) Quantification of bioluminescence intensity. n = 3. p value was calculated by unpaired Student’s t-test. *p < 0.05.
(I) Western blot of whole-cell lysates from CD34+ cells electroporated with Cas9 loaded with the indicated sgRNAs on day 8 post-electroporation, with culturing in myeloid conditions.
(J) qRT-PCR analysis of indels presence in CD34+ cells electroporated with Cas9 loaded with the indicated sgRNAs over the course of culturing in myeloid conditions. The effects of individual sgRNAs for SCP4 were averaged. n = 4.
(K) Quantification of the flow cytometry analysis of myeloid differentiation of CD34+ cells electroporated with Cas9 loaded with the indicated sgRNAs on day 8 post-electroporation, with culturing in myeloid conditions. The effects of individual negative controls and sgRNAs for SCP4 were averaged. n = 4.
All bar graphs represent the mean ± SEM. All sgRNA experiments were performed in Cas9-expressing cell lines. “e” refers to the exon number targeted by each sgRNA. The indicated sgRNAs were linked to GFP. ROSA, Mock, and NT, negative controls; PCNA and MYC, positive controls.
See also Figure S2.
