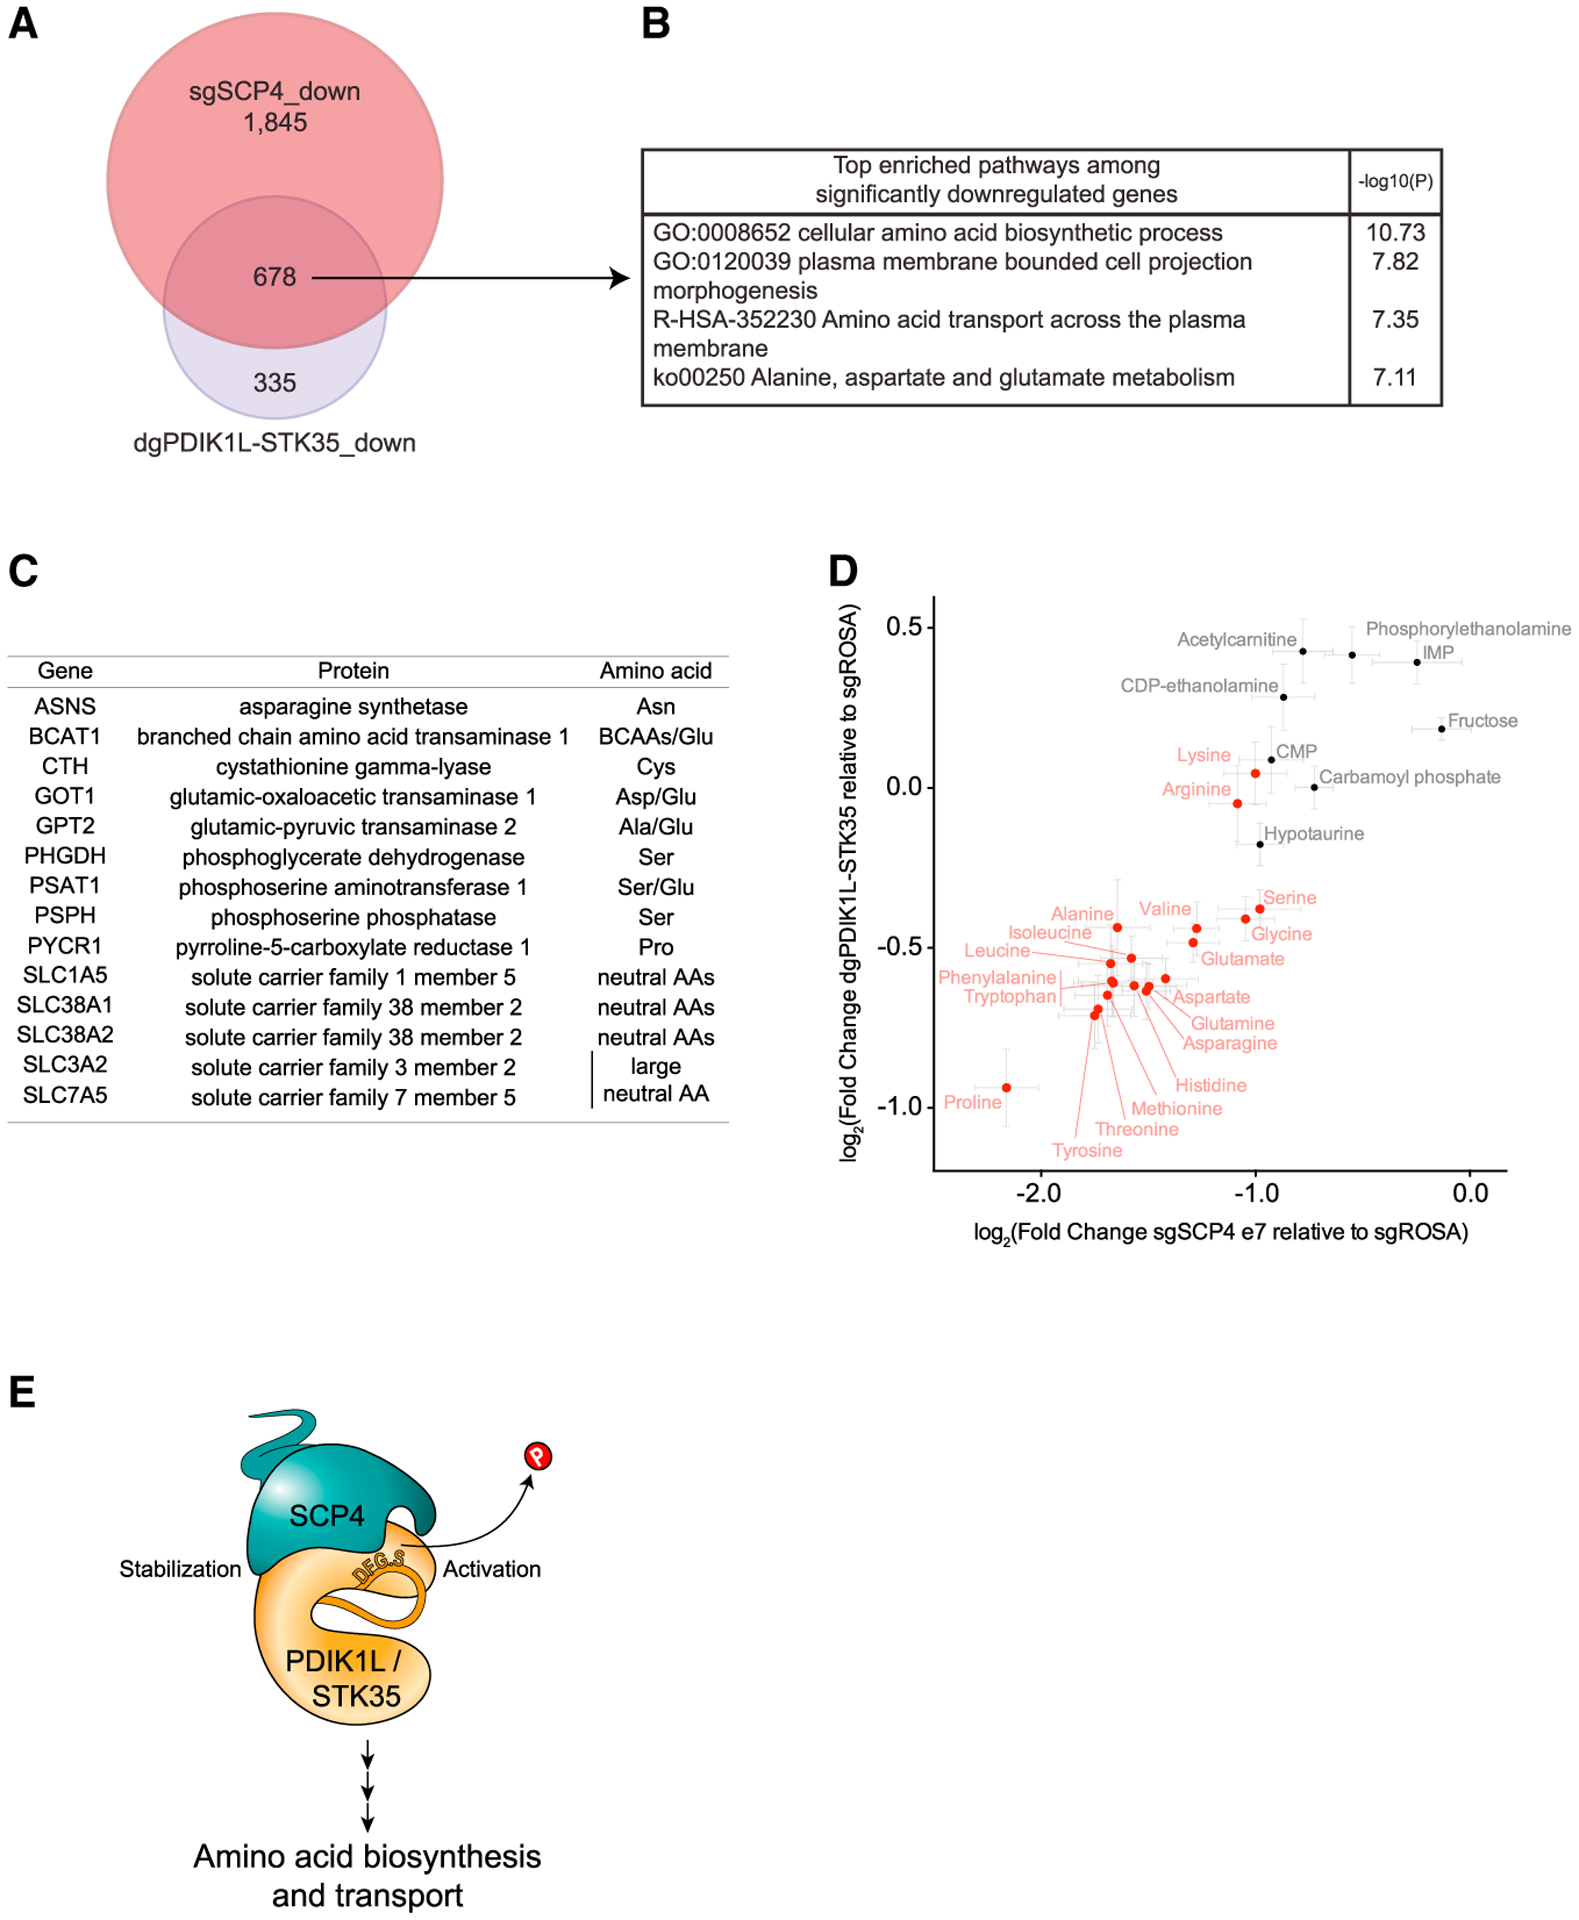
Figure 7. SCP4-STK35/PDIK1L complex is needed to sustain amino acid levels in AML.

(A) Venn diagram depicting the overlap between statistically significant downregulated genes in MOLM-13 cells upon SCP4 knockout and STK35/PDIK1L double knockout. DeSeq2 (n = 4).
(B) Ontology analysis of overlapping statistically significant downregulated genes in MOLM-13 cells upon both SCP4 knockout and STK35/PDIK1L double knockout.
(C) Selected statistically significant downregulated genes in MOLM-13 cells upon both SCP4 knockout and STK35/PDIK1L double knockout and the amino acids they are involved in biosynthesis or transport of.
(D) The correlation between log2 fold changes in the levels of selected metabolites upon SCP4 knockout and STK35/PDIK1L double knockout relative to negative control as measured by the MS analysis. Every dot represents the mean ± SEM (n = 6). Amino acids are in red, and there are a few unchanged metabolites in black for reference. Shown is a representative experiment of 3 independent biological replicates.
(E) Model.
See also Figure S7.
