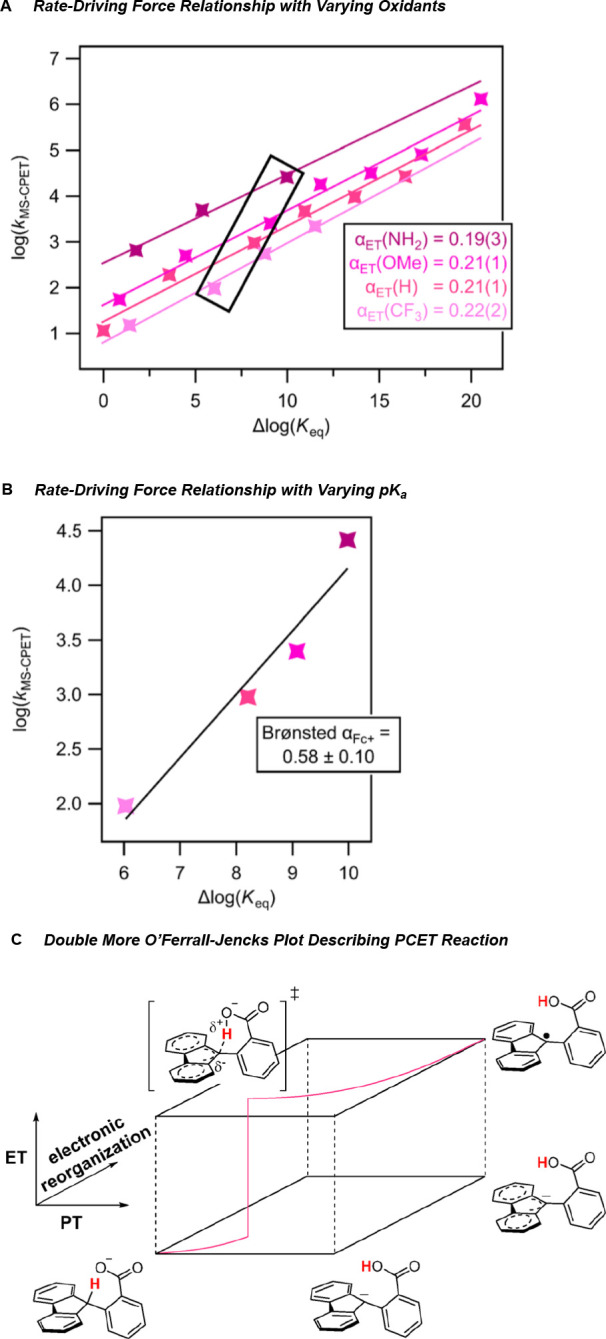
Figure 10.

Rate–driving force relationships in the concerted PCET activation of fluorenyl benzoates. (A) Plot of PCET rate constant versus driving force for PCET across a series of fluorenyl benzoates and oxidants. From top line to bottom line: R = NH2, OMe, H, CF3. The slope of each plot is the α value for ET for that substrate. (B) Plot of PCET rate constant versus driving force for PCET across a series of fluorenyl benzoates with a single oxidant (FeCp2+). The slope of the plot is the α value for PT. (C) Double More O’Ferrall–Jencks plot for the PCET activation of a fluorenyl benzoate. The horizontal planes represent progress in the PT coordinate and electronic reorganization coordinate, while the jump between the two planes represents the instantaneous ET that occurs between the fluorenyl benzoate and the oxidant. Reproduced with permission from ref (763). Copyright 2019 ACS Publishing.
