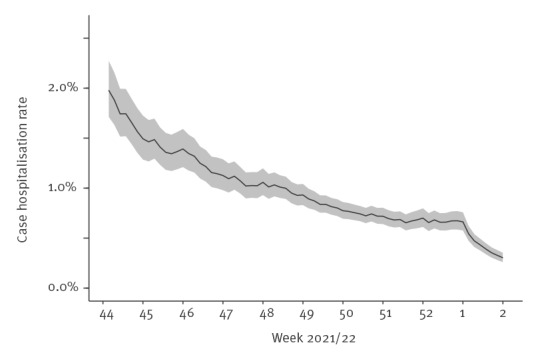
Figure 2.
10-day average case COVID-19 hospitalisation rate (unadjusted) as a function of time, Norway, 1 November 2021– 9 January 2022 (n = 239,391)
The figure shows the case hospitalisation rate by date of sampling. This rate is calculated as the 10-day averaged fraction of patients who are admitted to hospital (10-day average of hospitalised cases/reported cases by date of sampling). The calculation of case hospitalisation rate discounts the incidence of cases during the latest dates by the observed delay between testing and admission to account for potential right censoring [15].