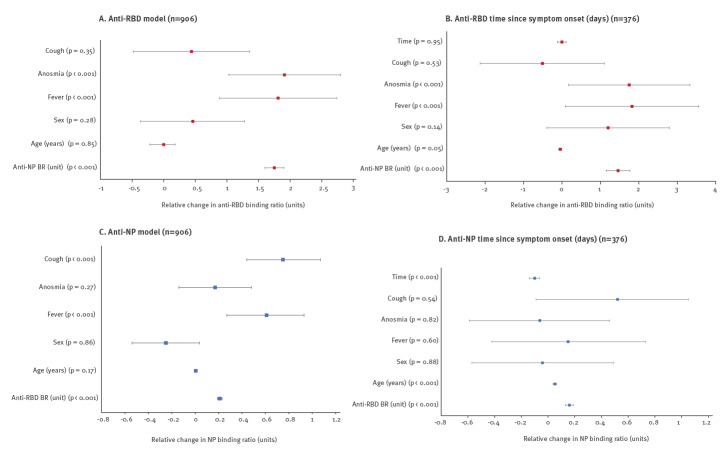
Figure 2.
Multivariate linear regression model of clinical variables associated with SARS-CoV-2 anti-RBD antibody response, London, United Kingdom, 17 April–17 July 2020 (n = 906)
anti-NP: anti-nucleocapsid antibody; anti-RBD: anti-receptor binding domain antibody; BR: binding ratio; SARS-CoV-2: severe acute respiratory syndrome coronavirus-2.
All 906 participants are included in the analysis in panels A and C; Panel B (anti-RBD BR model) and panel D (anti-NP BR model) include 376 participants (symptomatic individuals with clear date of symptom onset during the study period) in the analyses of time since symptom onset . All participants had a documented history of symptoms or documentation of no history of symptoms available. Among the 521 cases with symptoms, fever was reported in 346 (66.4%), cough in 334 (64.1%) and anosmia in 202 (38.8%). Relative change in anti-RBD BR is expressed per 1 BR unit. The results for fever (> 38 °C), anosmia and cough show relative increase or decrease in anti-RBD BR or anti-NP BR based on presence of that symptom. Age represents relative change in BR per year increase in age. Anti-NP BR represents the relative anti-RBD BR increase based on each single unit increase of anti-NP BR (panels A and B) and vice versa for panels C and D. Sex shows relative change in BR associated with female sex. Time is representative of relative change in BR per day between serological sampling and day 14 of symptoms. Whiskers represent lower and upper 95% confidence intervals.

