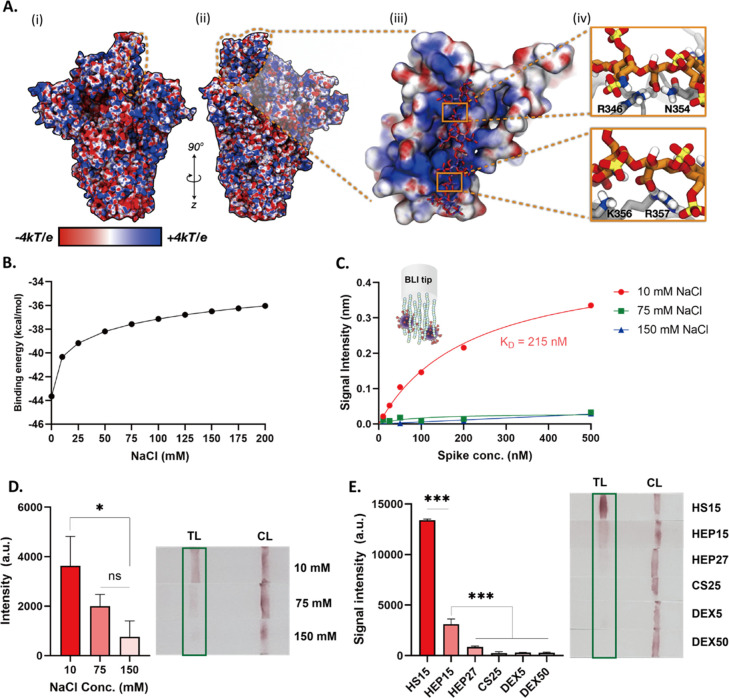
Figure 5.
(A(i)) Electrostatic potential map (ESP) of 1-up spike without glycans included for simple illustration. ESP is illustrated on a range from −4 to +4 kT/e. The RBD supersite is highlighted with an orange dashed line. (A(ii)) Rotated viewpoint of electrostatic potential map of 1-up spike. Again, ESP is illustrated on a range from −4 to +4 kT/e and the RBD HS supersite is highlighted with an orange dashed line. (A(iii)) Close up view of spike RBD (surface representation) and bound HEP octamer (hep8mer, licorice representation). Both spike RBD and hep8mer are colored according to their corresponding electrostatic potentials (ranging from −4 to +4 kT/e). (A(iv)) Close-ups of key interactions between hep8mer (licorice representation, orange carbon atoms) and spike RBD (gray cartoon representation) facilitated by R346, N354, K356, and R357. (B) Computational calculation of binding energy of hep8mer to spike RBD over a range of implicit solvent ionic strengths. (C) BLI results of HEP to spike in three different concentrations of NaCl (10, 75, and 150 mM). (D) Response of the lateral flow test in different ionic concentrations (10, 75, and 150 mM). (E) Screening results of HS15, HEP15, HEP27, CS25, DEX5, and DEX50 using LFSA. p values <0.05 (*), 0.01 (**) and 0.001 (***) determined using a one-way ANOVA with Tukey’s post hoc test.

