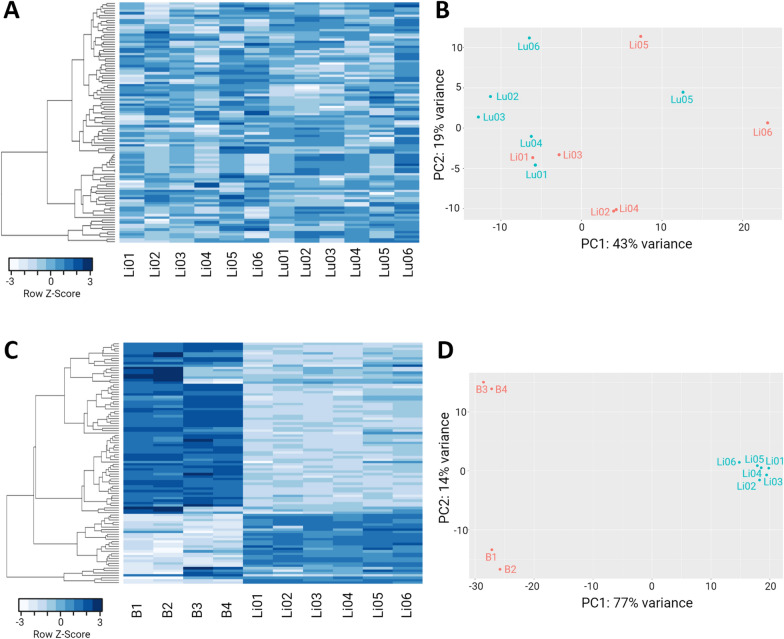
Figure 2.
Heatmap and principal component analysis (PCA) of expressed genes in protoscoleces from liver and lungs CE cysts from cattle and sheep. A Heatmap of the top 100 most variable expressed genes in PSC from sheep liver and lung CE cysts. PSC from sheep liver CE cysts are labeled Li01–06 and PSC from sheep lung CE cysts labeled as Lu01–06. B PCA of PSC samples from sheep liver CE cysts v/s PSC samples from sheep lung CE cysts; The red dots represent Li01–06 samples and the turquoise dots Lu01–06 samples. C Heatmap of the top 100 most variable expressed genes between PSC samples from cattle and sheep liver CE cysts. Samples B1–4 are from cattle liver CE cysts PSC and Li01–06 from PSC samples from sheep liver CE cysts. D PCA of PSC samples from cattle liver CE cysts v/s PSC samples from sheep liver CE cysts; Red dots represent B1–4 samples and turquoise dots the Li01–06 samples. Samples Lu01, Lu02, Lu03, Li01, Li02, and Li03 were obtained from the same animal. CE = cystic echinococcosis.

