
Fig. 3.
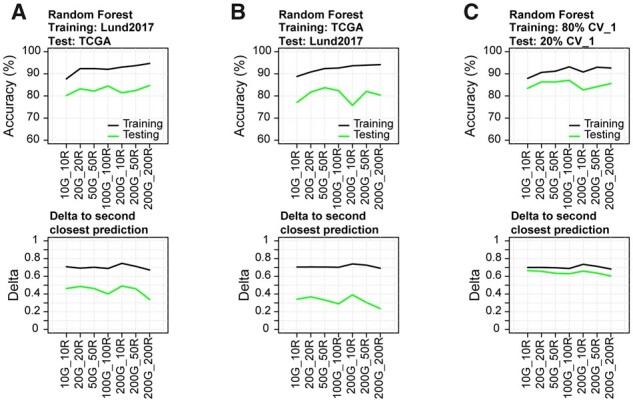
Random Forest model performance. Top row: Training and prediction accuracy across models trained on (A) Lund2017, (B) TCGA and (C) mixed Lund2017/TCGA data Bottom row: Average score difference between the predicted and second closest class
Official websites use .gov
A
.gov website belongs to an official
government organization in the United States.
Secure .gov websites use HTTPS
A lock (
) or https:// means you've safely
connected to the .gov website. Share sensitive
information only on official, secure websites.
Random Forest model performance. Top row: Training and prediction accuracy across models trained on (A) Lund2017, (B) TCGA and (C) mixed Lund2017/TCGA data Bottom row: Average score difference between the predicted and second closest class