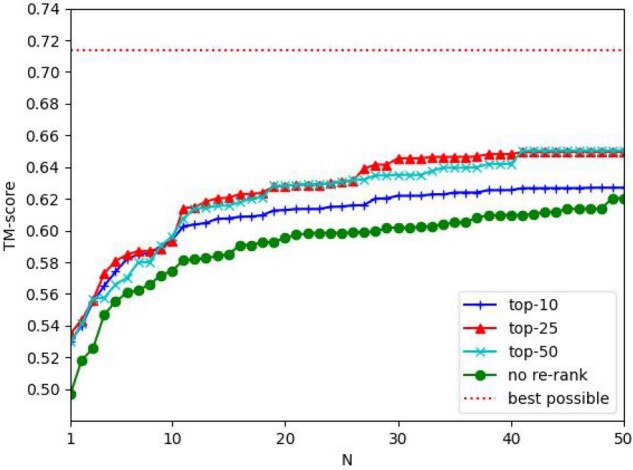
Fig. 3.

The average quality (measured by TMscore) of the selected decoys by top predicted contacts. The x-axis is the number of top decoys selected. In the legend, ‘top-10’, ‘top-25’ and ‘top-50’ represent that top 10, 25 and 50 predicted contacts are used to select docking decoys, respectively. ‘best decoy’ indicates the quality of the best decoys generated by HDOCK
