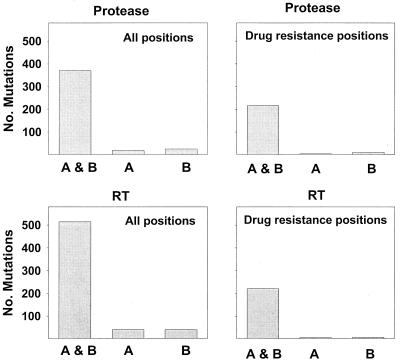
FIG. 4.
Each panel shows the mutations detected in common between the laboratories (A & B) as well as those mutations detected by laboratory A but not laboratory B (A) and those detected by laboratory B but not laboratory A (B). The panels on the left show the total number of mutations (differences from consensus B) for protease and RT. The panels on the right show the number of drug resistance mutations for protease and RT.

