Fig. 1.
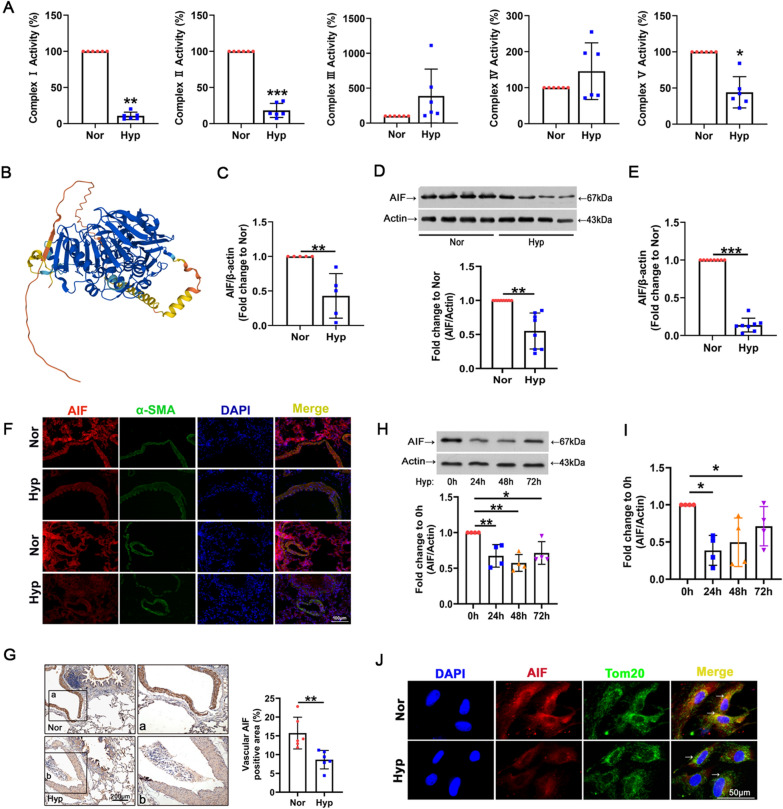
Hypoxia results in decreased AIF expression. A Activity of mitochondrial respiratory chain complexes I–V after exposure to hypoxia, with complex I showing the most severe damage (n = 6). B Schematic structural model of AIF protein. C Decreased AIF expression was found in plasma from the hypoxic group (n = 5). D, E AIF protein and RNA levels in the lung tissues of the hypoxic model (n = 8). F, G The location of AIF in the smooth muscle layer of lung tissues from the hypoxic model was determined by immunofluorescence (F, Scale bar = 100 μm) and immunohistochemical staining analysis (G, Scale bar = 200 μm) (n = 3). H, I Time course of AIF protein and RNA levels in PASMCs 0, 24, 48, and 72 h after hypoxia treatment. J Subcellular distribution of AIF in PASMCs as determined by immunofluorescence analysis. Scale bars: 50 μm (n = 3). All data are presented as the means ± standard deviation. *p < 0.05; **p < 0.01; ***p < 0.001; Nor normoxia, Hyp hypoxia

