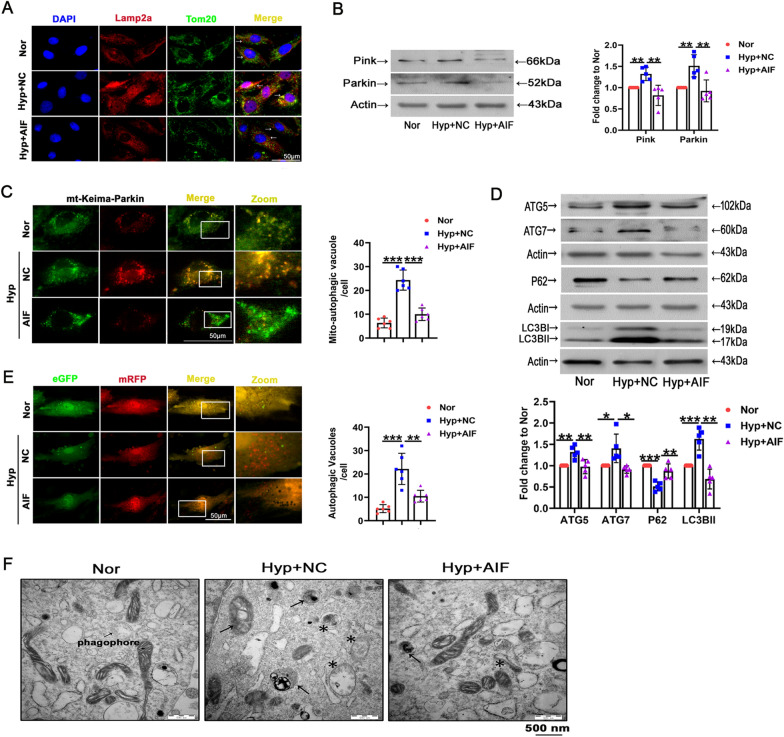
Fig. 3.
Effects of hypoxia and AIF on mitophagy and autophagy in PASMCs. A AIF influenced mitochondrial function by obstructing Tom20 and Lamp2a colocalization, as indicated by the decreased yellow area. Scale bars: 50 μm (n = 4). B PASMCs were exposed to hypoxia for 24 h, and the expression of Pink and Parkin was evaluated by Western blotting (n = 5). C AIF overexpression mitigated the alteration of mitophagy in PASMCs as determined by Mitophagy Keima-Red plasmid transfection. The number of mitochondrial autophagosomes (yellow dots) was calculated (n = 5). Scale bars: 50 μm. D The expression of LC3B-II, P62 and ATG5/7 was evaluated by Western blotting (n = 5). E Autophagic flux and the formation of autophagosomes were detected (n = 6). Scale bars: 50 μm. F Representative electron micrograph of cells after Nor and Hyp treatment. Asterisks represent autophagosomes and arrows represent autolysosomes. Scale bars: 500 nm (n = 3). All data are presented as the means ± standard deviation. *p < 0.05; **p < 0.01; ***p < 0.001; Nor normoxia, Hyp hypoxia, NC negative control

