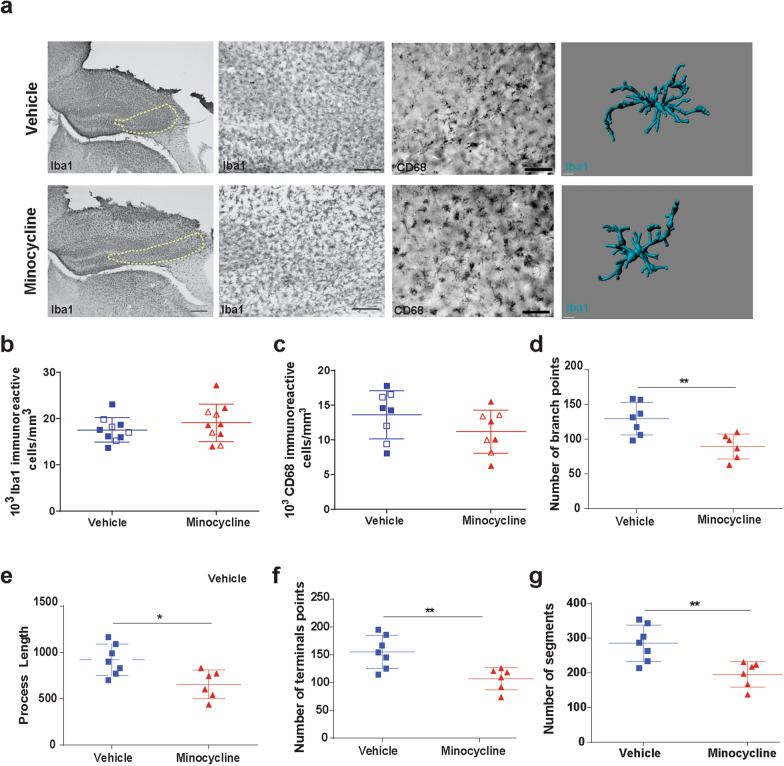
Fig. 3.
Minocycline modulates microglia morphology. a Representative image of Iba1+ and CD68 + cells in CA3 region of injured hippocampi. Region of interest for stereological quantification represented by yellow dashed line. Representative three-dimensional reconstruction images of microglia cells. b Quantification of the Iba1+ cells density. c Quantification of the CD68+ cells density. Male mice represented by closed symbols, female mice represented by open symbols. Quantification of the microglia morphology of d number of branch points, e process length, f number of terminal points, and g number of segments. Mean values are plotted ± SD, unpaired t test **p < 0.01, n = 8 mice per group

