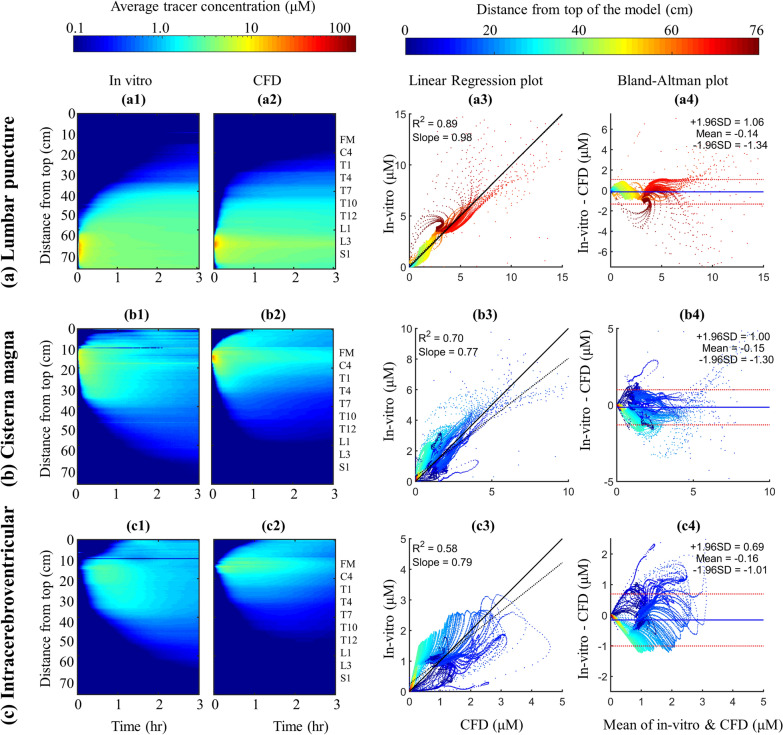
Fig. 4.
Cross-sectional average tracer concentration over 3-h and regression plots to compare numerical simulation with in vitro model at different injection locations a Lumbar puncture, b Cisterna magna and c Intracerebroventricular injection. a1, b1, c1 Spatial temporal plot for cross-sectional average tracer concentration for CFD at LP, CM and ICV, respectively. a2, b2, c2 Spatial temporal plot for cross-sectional average tracer concentration for in vitro model at LP, CM and ICV, respectively. a3, b3, c3 the linear correlation plots for agreement of in vitro and numerical simulation results for spatial–temporal cross-sectional average tracer concentration over 3-h at LP, CM and ICV, respectively. The linear regression is shown in black dashed line and the idea line is shown in black solid line. a4, b4, c4 Bland–Altman plots for agreement of in vitro and numerical simulation results for spatial–temporal cross-sectional average tracer concentration over 3-h at LP, CM and ICV, respectively. The limit of agreement (95% confidence intervals) lines are shown in dashed lines and the mean value of differences between CFD and in vitro is shown in solid blue line

