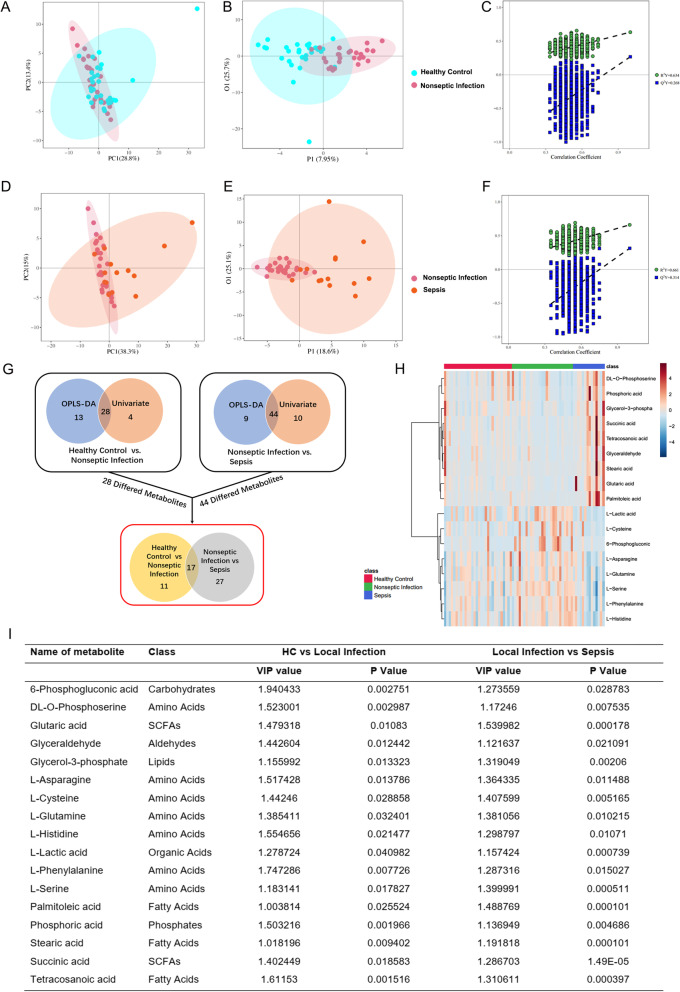
Fig. 2.
Multivariate metabolite data analysis. a, b Principal component analysis (PCA) scores plots (left panels) and orthogonal partial least square-discriminant analysis (OPLS-DA) scores plots (right panels) of patients with non-septic infection versus those of healthy controls. Shaded areas are 95% confidence interval (CI) regions of each group. c Permutation test for OPLS-DA model of patients with non-septic infection versus that of healthy controls. d, e PCA and OPLS-DA score plots of patients with non-septic infection versus those of patients with sepsis. Shaded areas are 95% confidence interval (CI) regions of each group. f Permutation test for OPLS-DA model of patients with non-septic infection versus that of patients with sepsis. g Schematic diagram of data analysis procedures. h Heatmap showing abundance of 17 metabolites based on VIP scores of patients with sepsis, patients with non-septic infection, and healthy controls. i Differentiated metabolites among patients with sepsis, patients with non-septic infection, and healthy controls

