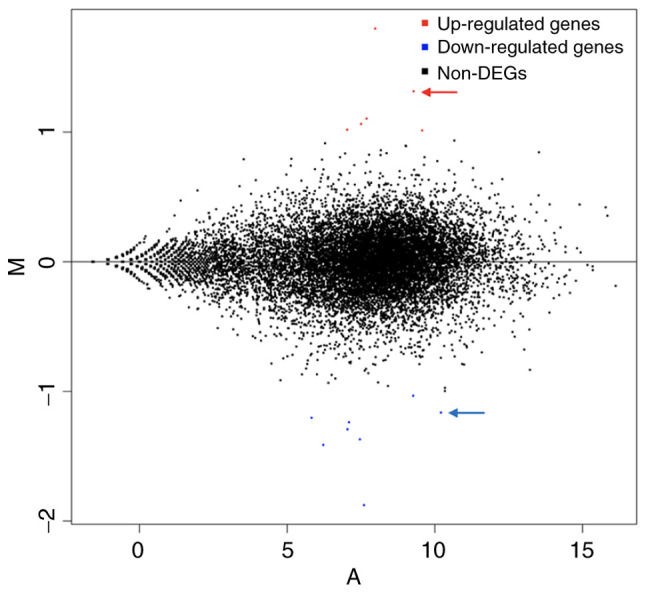
Figure 6.

MA map (produced by R software DEseq2) of differentially expressed genes after MAGEA6 overexpression. Each dot in the MA map represents a gene. Abscissa represents the log2 (FPKM) or the A value, which is the logarithmic value of the mean expression quantity in Eca109-MAGEA6-3.1 and Eca109-3.1 groups. Ordinate is M value: Log2 (Fc), which is the logarithmic value of the multiple of gene expression difference between the two samples, used to measure the difference in gene expression. In the figure, red dots represent upregulated genes, blue dots represent downregulated genes and black dots represent not differentially expressed genes. Fc, fold-change; A, Log2(FPKM) value; B, Log2(Fc); MAGEA6, melanoma antigen gene family A; DEGs, differentially expressed genes; MA, Minus-vs.-Add.
