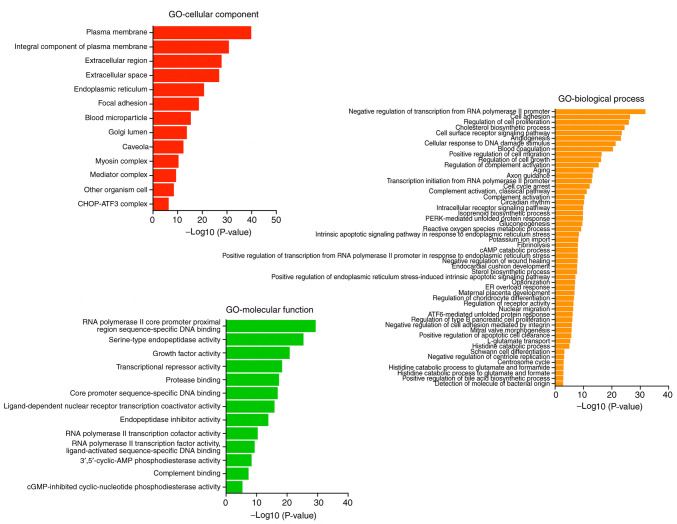
Figure 8.
GO function classification chart of the differentially expressed genes after MAGEA6 overexpression. Functional GO analysis obtained from the three aspects of cellular component, biological process and molecular function is presented in the figure. The x-axis represents the -log10(P-value), whilst the y-axis represents a classification and each row is a subclass. MAGEA6, melanoma antigen gene family A; GO, Gene Ontology; PERK, (PKR)-like endoplasmic reticulum kinase; ER, endoplasmic reticulum; ATF, activating transcription factor; CHOP, C/EBP homologous protein.

