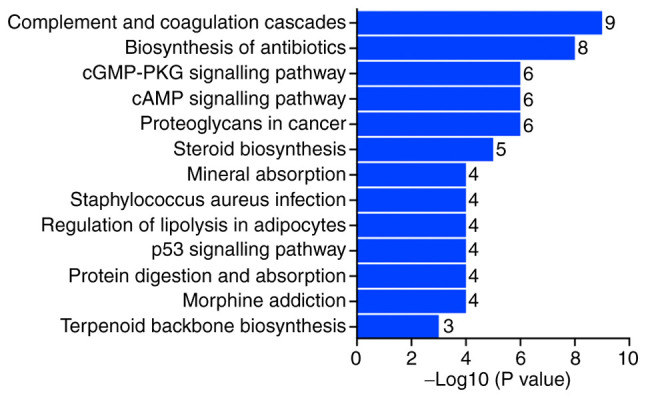
Figure 9.

Kyoto Encyclopaedia of Genes and Genomes pathway function classification map of the differentially expressed genes after MAGEA6 overexpression. The x-axis represents the -log10(P-value), whilst the y-axis represents a classification and each row is a subclass. MAGEA6, melanoma antigen gene family A; PKG, protein kinase G.
