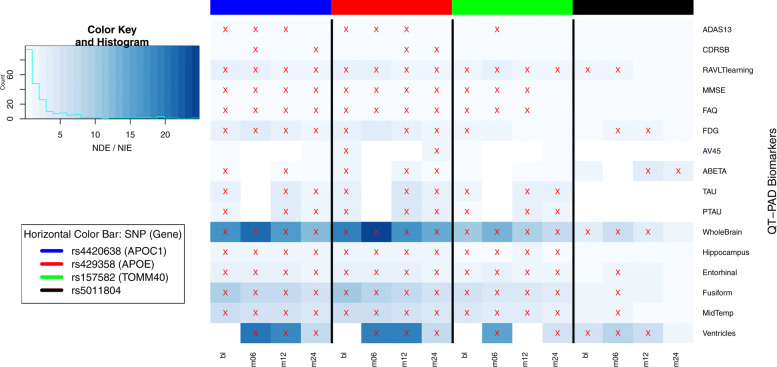
Fig. 3.
Visualizing the proportion of NDE/NIE versus visit code per QT-PAD outcome. Using the results of the mediation analysis, we plotted the proportion of the natural direct effect (NDE) versus the natural indirect effect (NIE) over time per outcome. Outcomes with a significant NDE and NIE have been marked with a red ‘X‘; the horizontal color bar represents the SNPs for which the mediation effect has been measured. Although the primary findings are focused on rs5011804, the mediation effect coefficients for three other AD SNPs are shown here for reference

