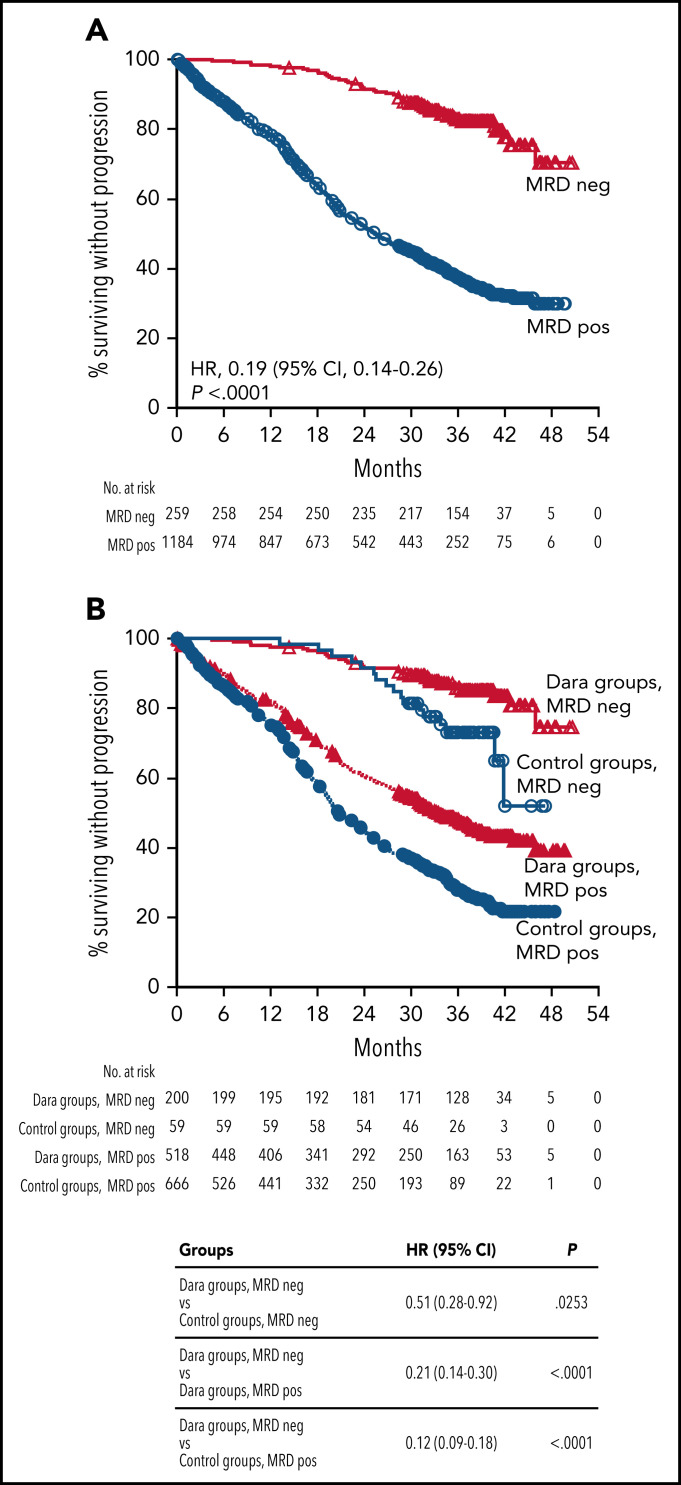
Figure 3.
PFS by MRD status (10−5) among all patients in MAIA and ALCYONE and in the pooled daratumumab-based combination groups vs control groups. Kaplan-Meier estimates of PFS based on MRD negativity in the ITT populations. MRD negativity was assessed at a threshold of 1 tumor cell per 105 white blood cells. (A) The red line shows patients who achieved MRD negativity at any time since randomization; the blue line shows patients who were MRD positive. (B) Red lines show regimens containing daratumumab (D-Rd and D-VMP); blue lines show standard of care regimens (Rd and VMP). A total of 5 patients who achieved a best response of VGPR were also MRD negative (all from the D-VMP arm of ALCYONE). Dara, daratumumab; VGPR, very good partial response.

