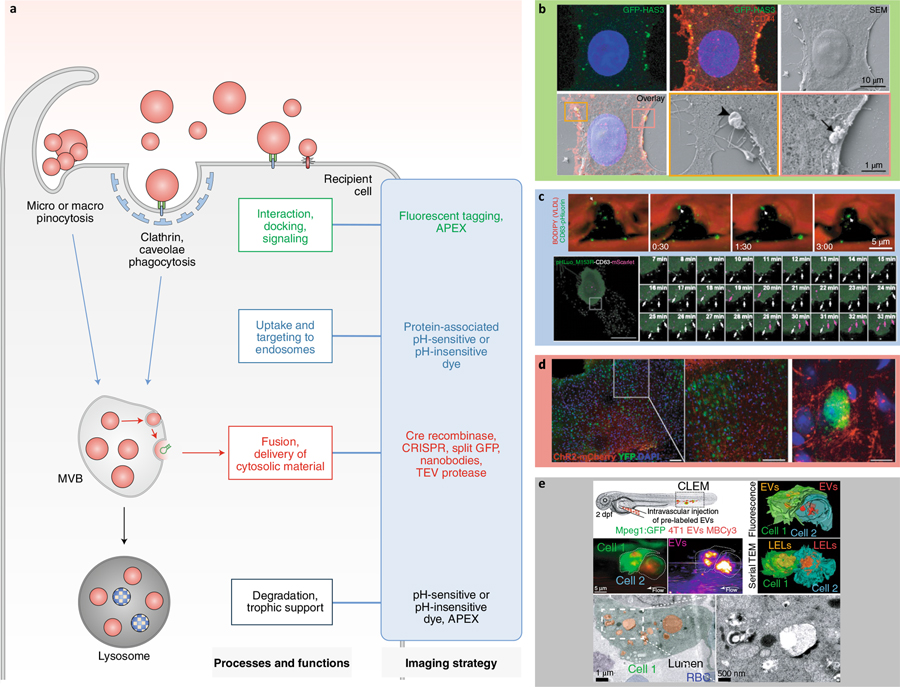
Fig. 4 |. Tagging strategies to image EV interaction, uptake, and fate.

a, Different tagging strategies (blue box) reveal distinct aspects of EV–cell interactions. TEV, tobacco etch virus. b–e, Imaging strategies to track the fate and functions of EVs. b, Correlative light and scanning electron microscopy shows GFP-HAS3-labeled EVs interacting with the PM of receiving cells115. Arrowhead, large EV; arrow, cluster and individual EVs of different sizes. c, Tracking uptake of endogenous CD63-pHluorin-labeled EVs in the D. rerio vasculature17 (top); and tracking double-labeled pHluorin-CD63-mScarlet EVs inside and outside HT1080 cells48 (bottom). VLDL, very low density lipoprotein. Arrows, internalized EV (top). White arrows, external EVs; purple arrows, internal EVs (bottom). d, Ex vivo mapping of EV mRNA using a Cre recombinase strategy in the mouse brain118. e, Correlative light and electron microscopy shows Membright Cy3 lipid dye-labeled EVs accumulating in endolysosomes in D. rerio patrolling macrophages.19 dpf, days post-fertilization; LEL, late endo-lysosome; RBC, red blood cell.
