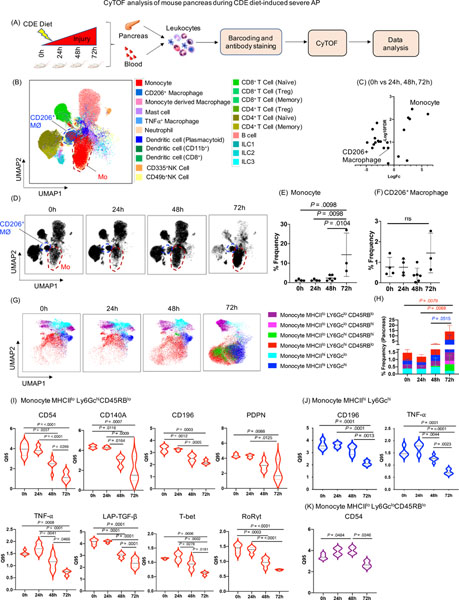
Figure 2. CyTOF analysis of mouse pancreas during CDE diet-induced SAP.
(A) Experimental set up for induction of SAP and CyTOF analysis of pancreas and blood. (B) UMAP plot showing various immune cell clusters in the pancreas. (C) Volcano plot showing differential abundance analysis of immune cells at all the time point comparisons (24h, 48h, 72h) with control mice (0h). Monocytes appeared as the top altered immune cell. (D) UMAP plot showing monocytes cluster (red circle) and CD206+ macrophages cluster (blue circle) along with the kinetics of SAP development. (E, F) Dot plot showing frequency of monocytes and CD206+ macrophages in the pancreas. (G, H) UMAP plots showing six novel monocyte subsets and their frequency. (I) DE analysis of monocyte MHCIIloLy6GchiCD45RBlo revealed reduced expression of CD54, CD140a, CD196, PDPN, TNF-α, LAP-TGF-β, T-bet, RoRγt; whereas, (J) monocyte MHCIIhi Ly6Gchi showed reduced expression of CD196, and TNF-α during SAP. (K) DE analysis of monocyte subset MHCIIlo Ly6GcloCD45RBlo revealed induced expression of CD54 at 48h and then reduced at 72h during SAP. Mo- monocytes; CD206+ MØ- CD206+ macrophages

