Figure 6.
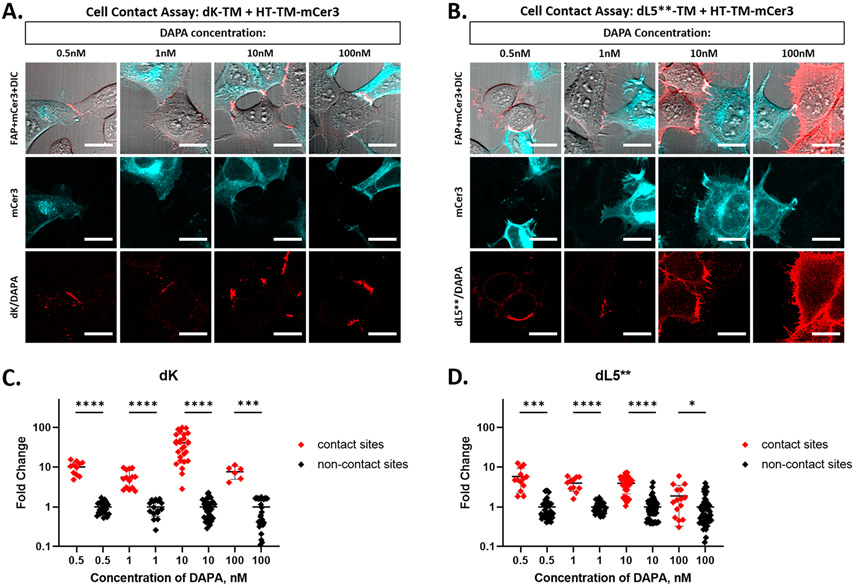
The dK FAP improves cell contact labeling selectivity. (A, B) HEK293 cells expressing HT-TM-mCerulean3 (cyan) and either dK-TM (A, red) or dL5**-TM (B, red) were coplated on a poly-l-lysine coated dish. The live cells were labeled with DAPA dye at 0.5 to 100 nM in OptiMEM media and imaged immediately without removal of the dye. All imaging was collected using a Zeiss 880 LSM with mCerulean observed with 405 nm excitation, 25% laser power, and FAP observed with 633 nm excitation. The laser powers for the 633 nm channel are (A) 55%, 25%, 25%, 0.4% and (B) 0.4% for all. The scale bars are 20 μm. (C, D) Quantitation of cell contact contrast: In two to five images per labeling condition, brightness of cell contact sites was measured from the perimeter of FAP expressing cells using a 6.37 pixel2 circular ROI. ROIs were separated into contact and noncontact sites based on the presence or absence of proximal mCer3 signal. The brightness of each sample is normalized to the mean noncontact fluorescence and plotted as fold change over mean noncontact fluorescence for each DAPA concentration. As concentration increases from 0.5 nM to 100 nM, the difference between the contact and noncontact zone becomes less significant for dL5** (t test, two sided) but is maintained for dK. Both images and extracted data indicate differential contact site specificity observed in dK versus dL5** and show loss of specificity with increasing DAPA concentration in dL5** panels.

