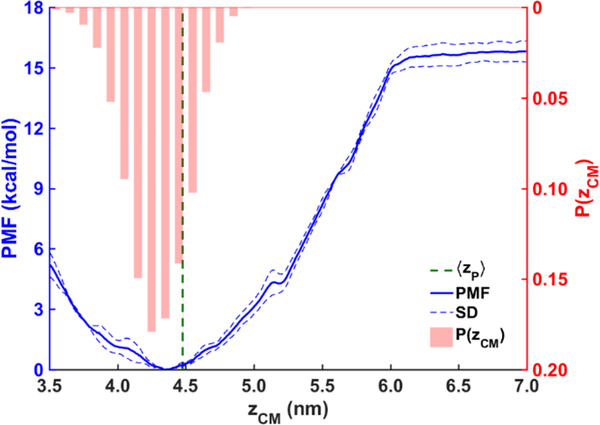
Figure 12:
PMF (blue) of the AI helix binding to the LDe surface, obtained with the umbrella sampling simulations. The error bars (blue dashed lines) were obtained from the standard deviation of the last three blocks. The normalized probability distribution of the AI helix P(zCM) (red bars) and the average location of the PL phosphorous atoms ‹z›P (green dashed line) were obtained from the unbiased MD simulations.

