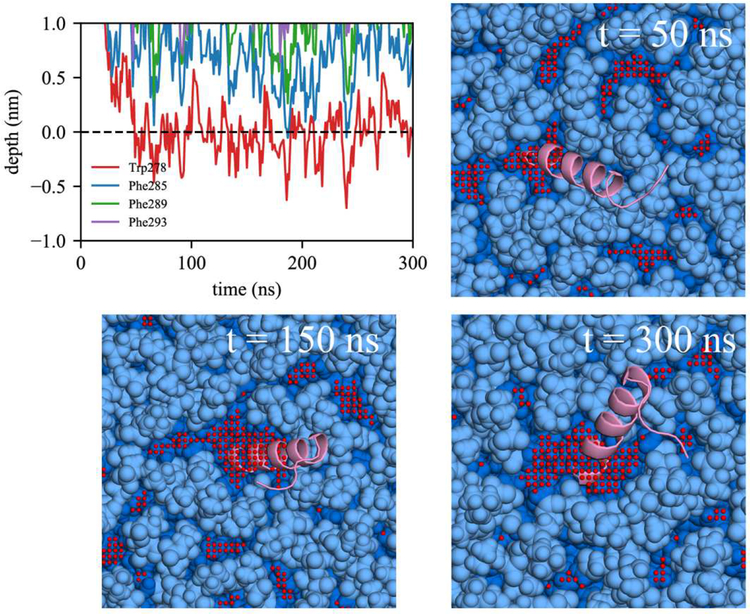
Figure 8:
Unsuccessful binding of the AI helix in BI0. The depth profile is shown in top left. The average Z position of the phosphorus atoms of the upper leaflet was set to 0. The positive Z is toward water and the negative Z toward the membrane center. Snapshots with simulation times are shown. The light and dark blue indicate polar groups and acyl chains of PLs, respectively. The PL acyl defects (red) are colocalized. The AI helix is shown in pink. Only the part of the system is shown in this figure. The actual membrane system is larger.

