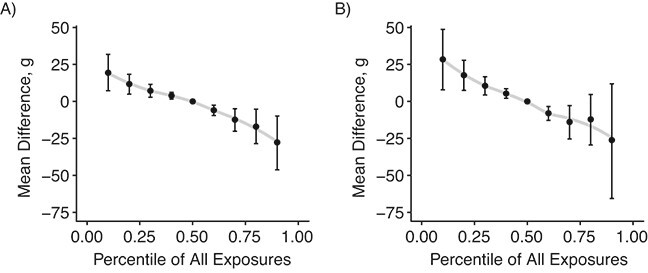
Figure 3.

Posterior mean difference (points) and 95% credible intervals (bars) for contrasts between population interventions in which all individuals have arsenic, beryllium, chromium, mercury, nickel, and selenium exposures simultaneously set to a percentile of their observed values, where the referent intervention is to set all exposures to the population median values (medians are given in Table 1). A) Results from the primary model with Bayesian model averaging (model A in Table 3); B) results from the hierarchical Bayesian model with no selection (model J in Table 3). Scatter plot smoothing lines (gray) are shown for visual reference.
