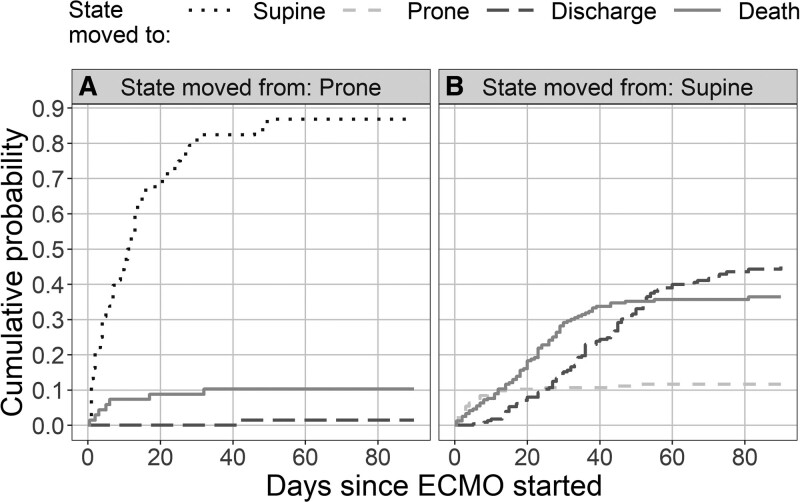
Figure 1.
Cumulative probabilities over time for the four states. The plots show the cumulative probability over time of moving between states. A, The probabilities for patients in the “ECMO and prone” state. B, The probabilities for patients in the “ECMO and supine” state. There is a steady accumulation of deaths in patients in the supine group (solid line [B]), although this slows after around 40 d. The movement of patients from the supine to the prone group greatly reduces after around 12 d (dashed gray line [B]). ECMO = extracorporeal membrane oxygenation.

