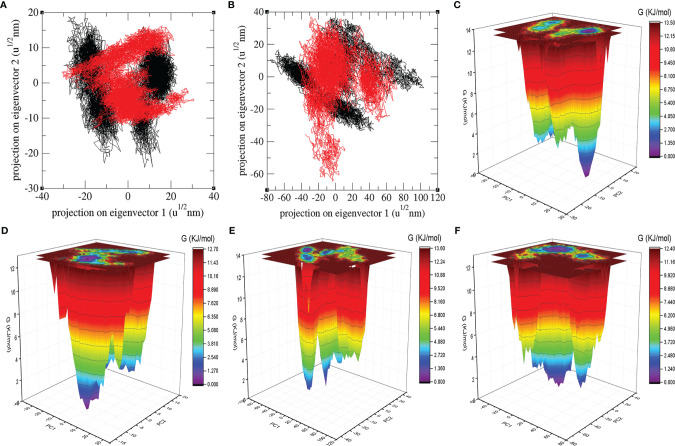
Figure 5.
Atomic projections and Gibbs energy landscape. The atomic projections on eigenvectors indicated different states of (A) Mprotease (black) and Mprotease-psilacetin (red), (B) HIK6 (black) and HIK6-psilacetin (red). The GFE landscapes are plotted for (C) Mprotease, (D) Mprotease-psilacetin, (E) HIK6, and (F) HIK6-psilacetin, respectively.

