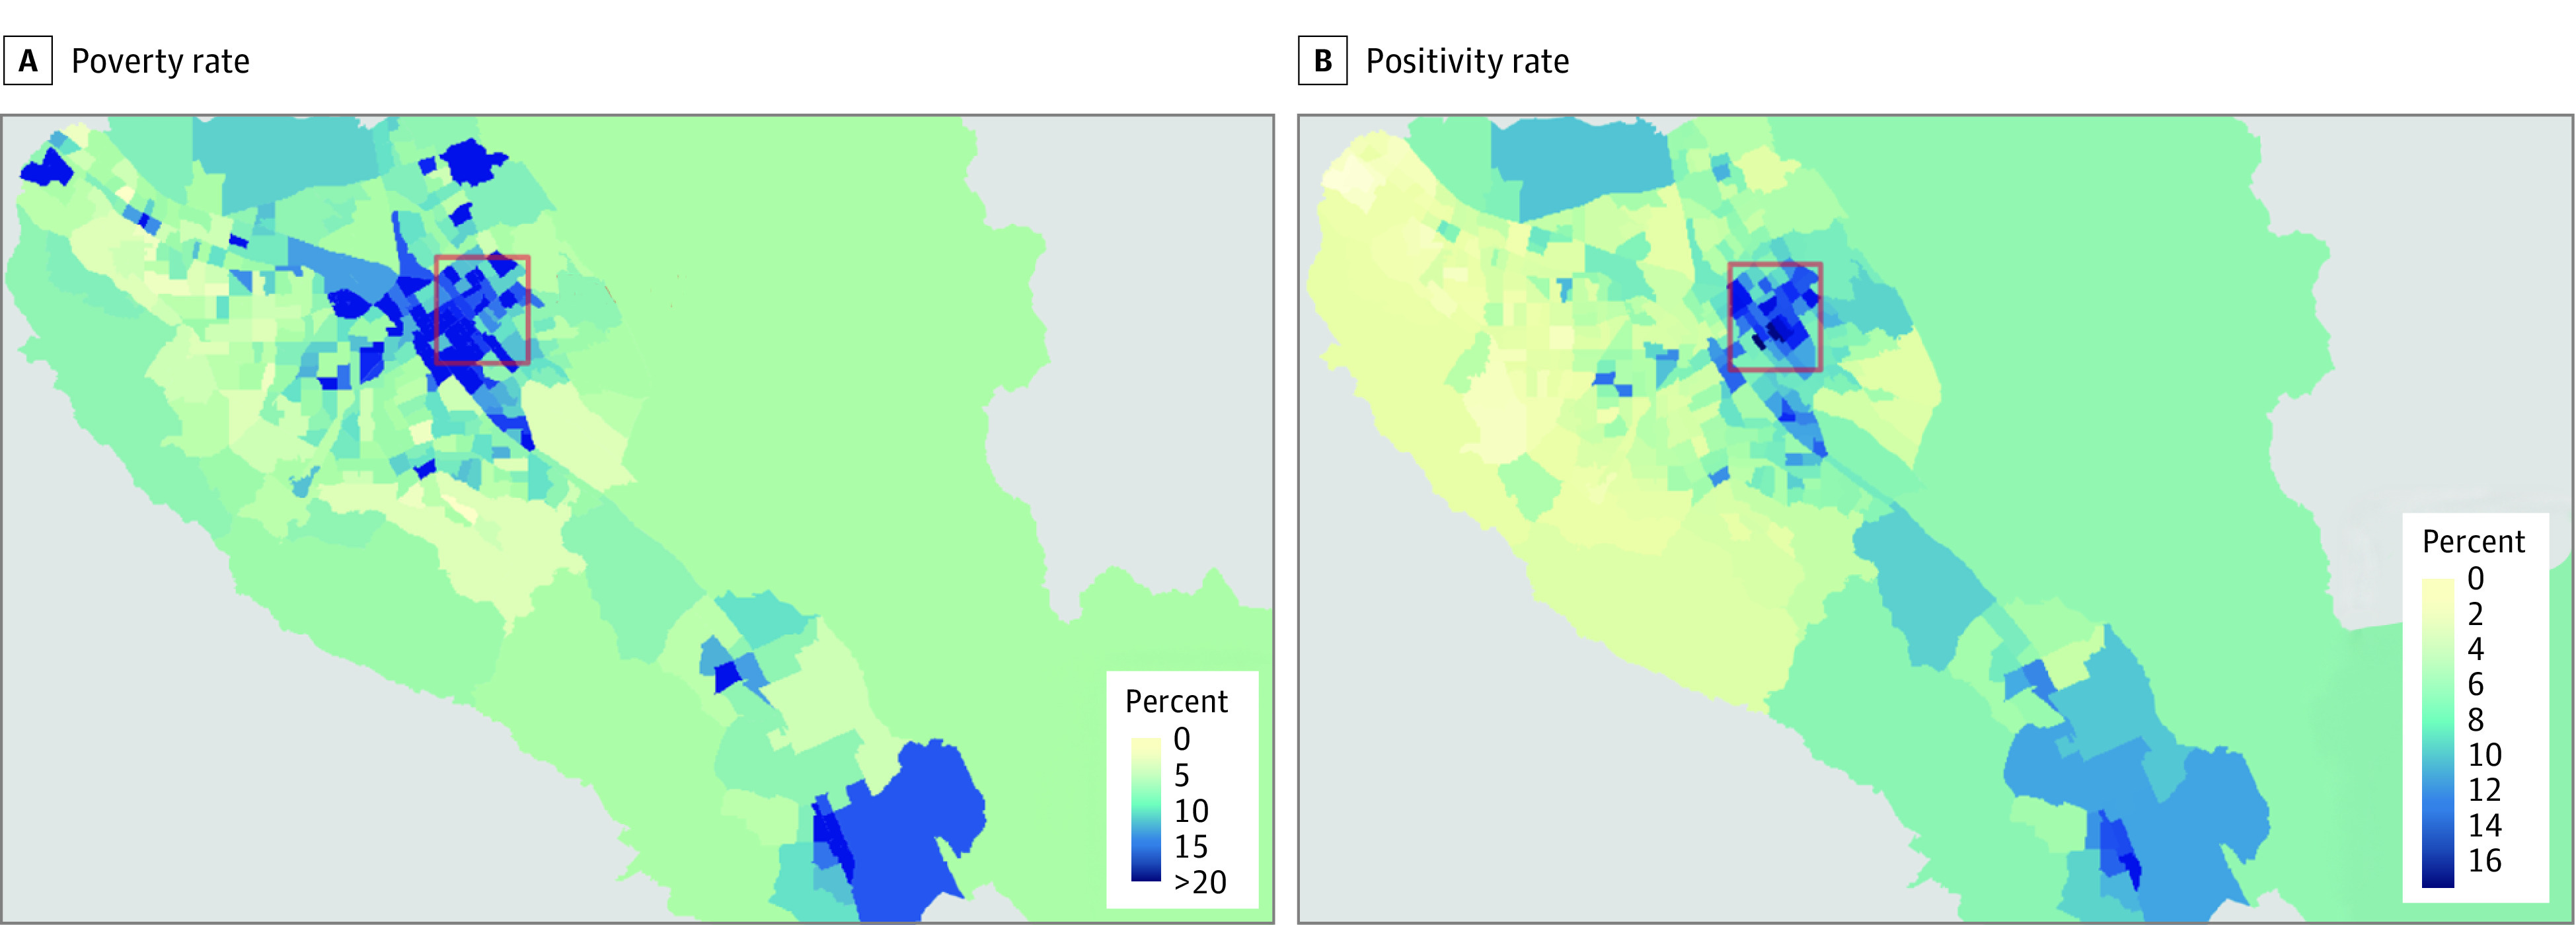
Figure 1. Poverty and COVID-19 Positivity Rates in Santa Clara County, California.

A, The poverty rate is calculated as percentage of residents living below the poverty line, from a Santa Clara County Public Health Department report from the 2015 American Community Survey. B, The positivity rate is calculated as the percentage of all conclusive tests returning positive results at the census tract level from the California Reportable Disease Information Exchange database. Both rates were aggregated from November 18 to December 18, 2020, 4 weeks before the intervention began. The red rectangle indicates the area of East San Jose in which the intervention took place.
