
Figure 1. Cases per Day Among the 4 Simulated Policy Responses to the COVID-19 Pandemic .
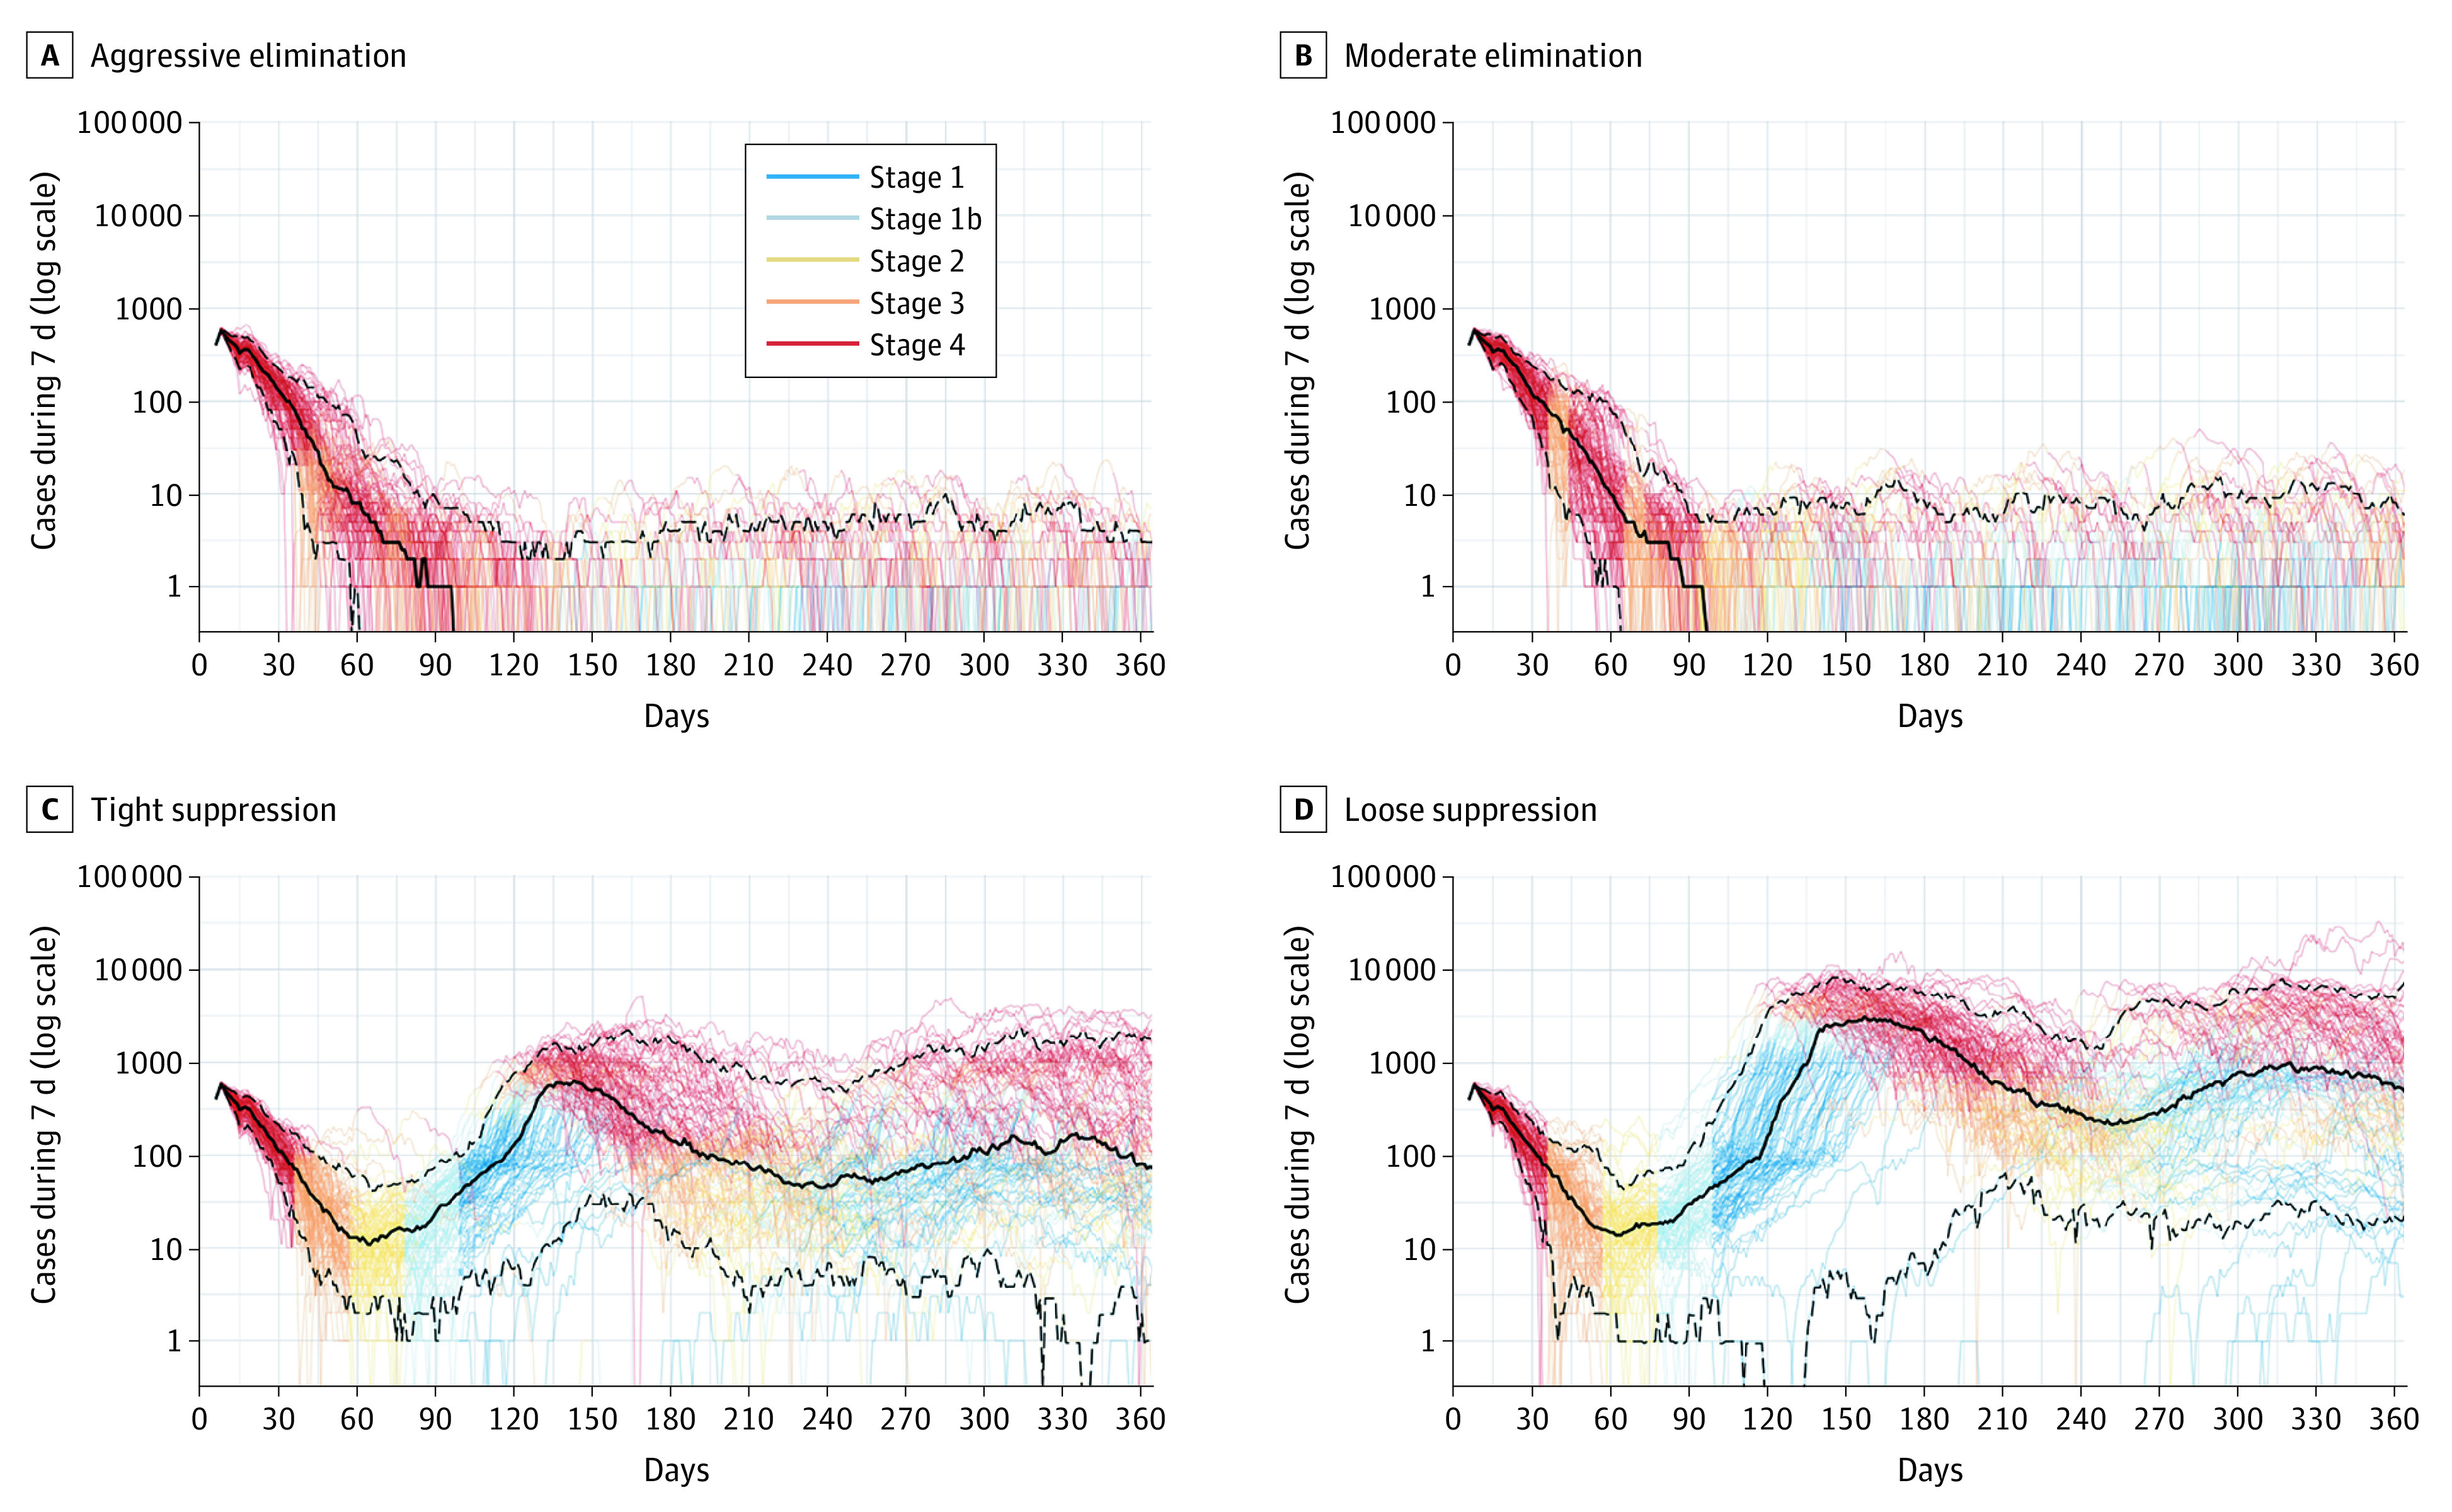
Traces are for each of 100 agent-based model iterations, with coloring indicating the stage of restrictions active over time for each iteration. The solid black lines indicate the medians across 100 iterations; dashed black lines, 5th and 95th percentiles across 100 iterations.