
Figure 2. SARS-CoV-2 Infections, Time in Stages of Lockdown, GDP Loss, Net Health Expenditure, and HALY Loss Among the 4 Simulated Policy Responses to the COVID-19 Pandemic .
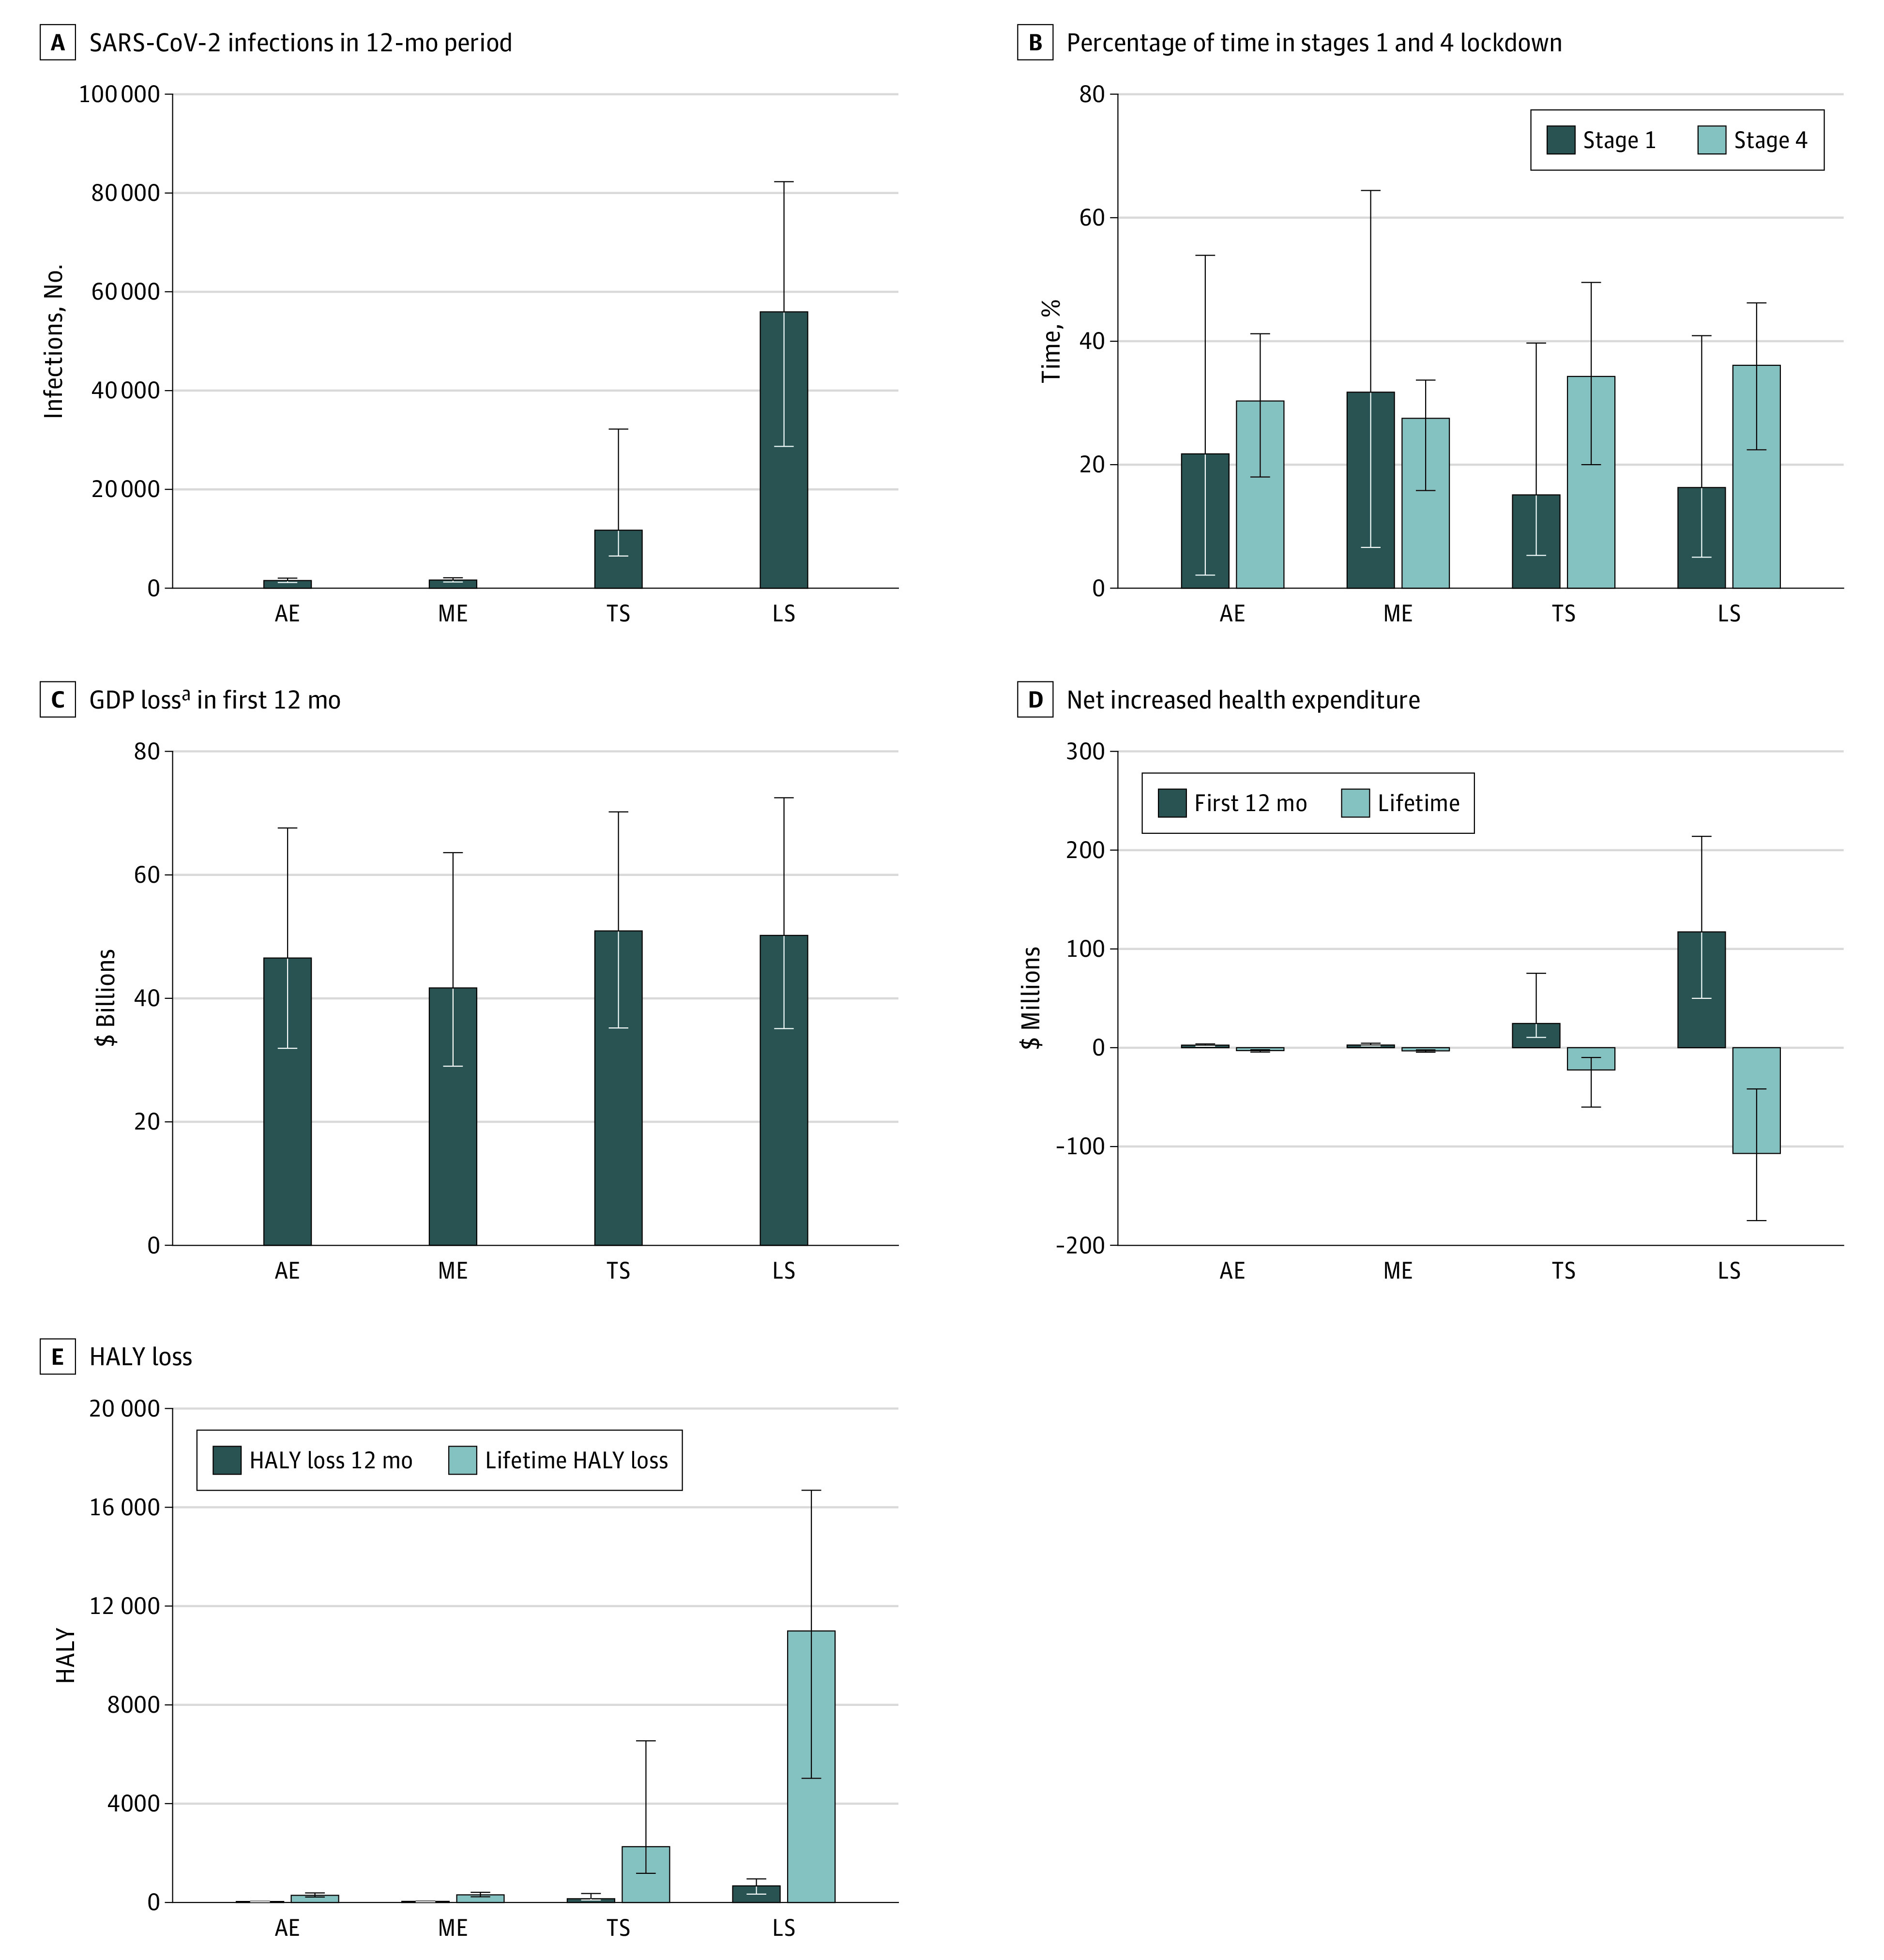
All data are incremental to pre–COVID-19 business as usual. Data used to populate these figures are shown in eTables 6 and 7 in the Supplement. Error bars indicate 90% simulation intervals. AE indicates aggressive elimination; GDP, gross domestic product; HALY, health-adjusted life-years; LS, loose suppression; ME, moderate elimination; and TS, tight suppression.
aLosses are before factoring in the (large) economic stimulus packages; see footnote to eTable 6 in the Supplement for details.