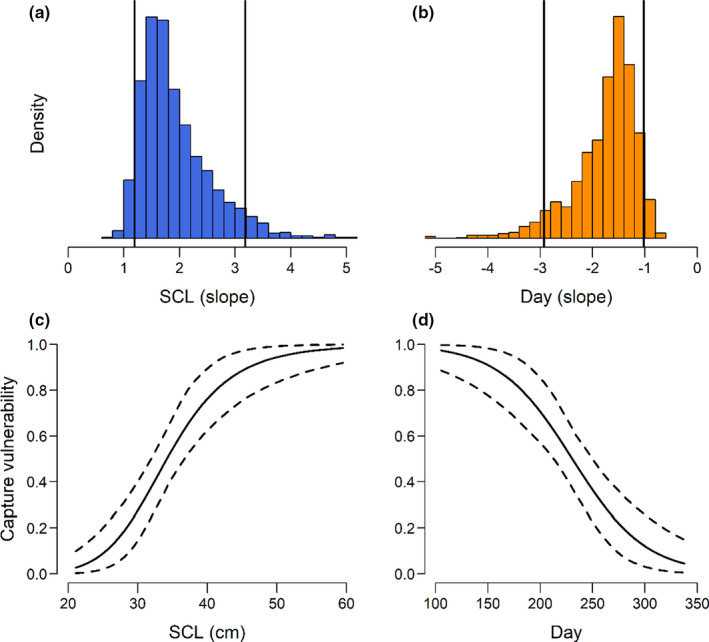
FIGURE 6.

Posterior distribution of the slope with a 90% highest density interval (HDI, vertical lines) for straight carapace length (SCL, panel a) and day of year (day, panel b) and associated pier‐capture vulnerability estimates with 90% confidence limits (dashed lines) across a range of covariate values (panels c and d). The SCL slope and estimates are interpreted as the relationship with pier use with day of year held at mean levels (and vice versa). The curvature in the slopes is an artifact of the scaling to a probability between 0 and 1 from the logit scale and back transformation of SCL from the natural‐log scale. These are straight‐line relationships on the model scale
