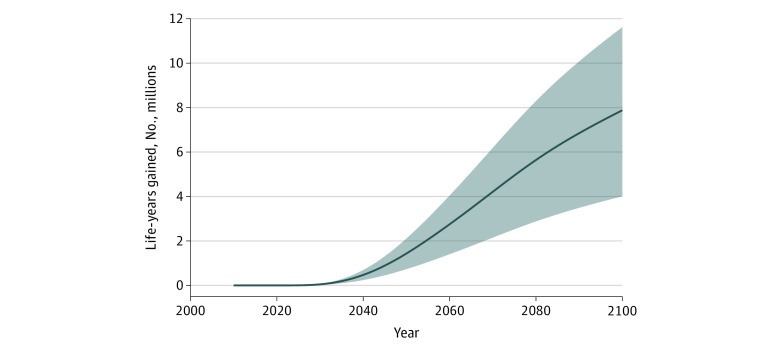
Figure 3. Cumulative Life-Years Gained in the US Using a US Graphic Health Warning Scenario, 2022 to 2100.
The solid line represents the main policy scenario (initiation reduced by 10% and cessation increased by 50% in 2022). Shading indicates the most optimistic (initiation reduced by 15% and cessation increased by 75% in 2022) and conservative (initiation reduced by 5% and cessation increased by 25% in 2022) scenarios.

