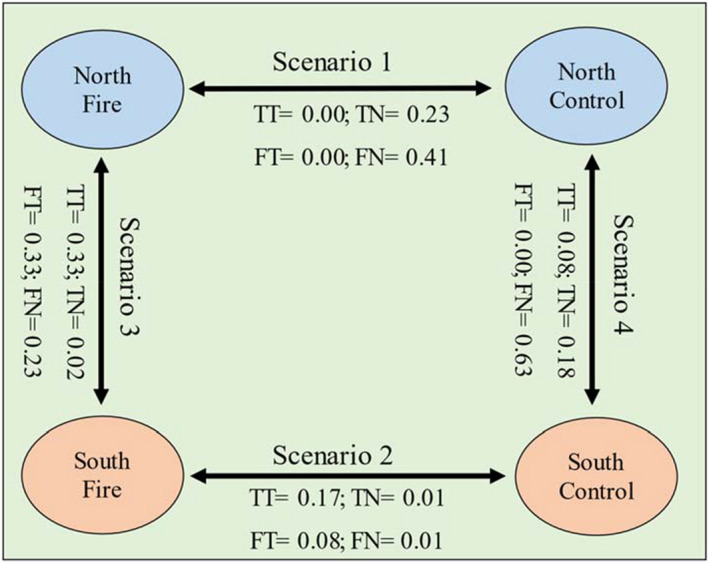
FIGURE 6.

Partitioning taxonomic and functional β‐diversity into turnover and nestedness components in a pairwise comparison in four scenarios including between the same exposure (NF and NNF) and same treatment (NF‐SF and NNF‐SNF). TT and FT are taxonomic and functional turnover, and TN and FN indicate taxonomic and functional nestedness
