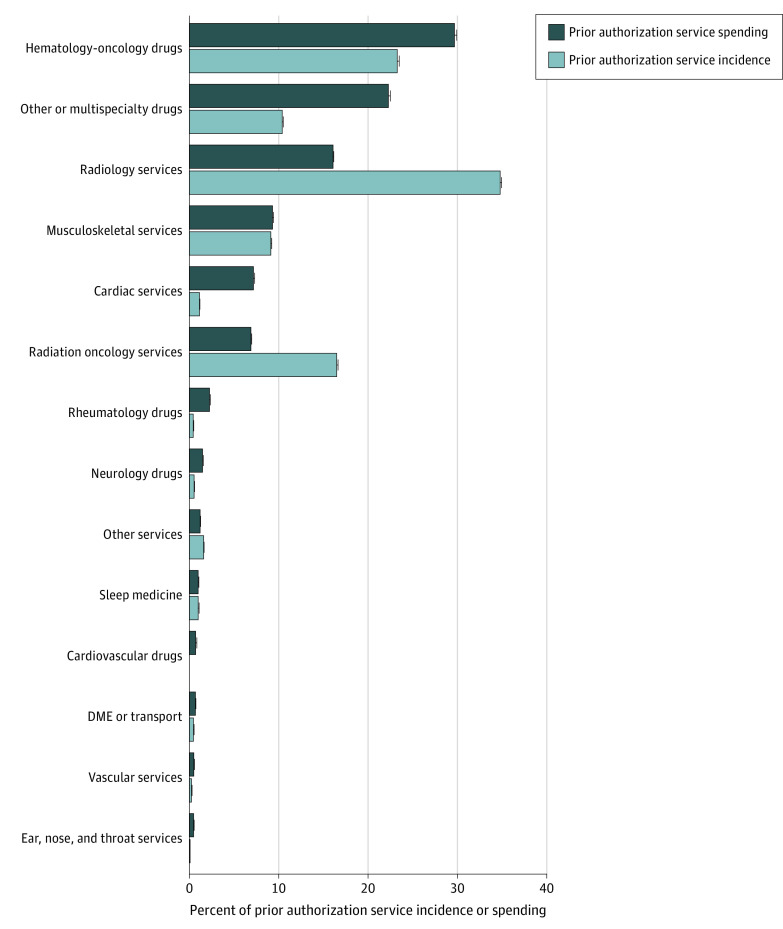
Figure 2. Shares of Incidence and Spending for Prior Authorization Services, by Service Type.
Count refers to the number of unique incidences of service provision. See the eAppendix in the Supplement for all service category assignments. “Other services” consists of nondrug services contributing to less than 0.05% of prior authorization spending, including nondrug services in dermatology, gastroenterology, hematology or oncology, laboratory medicine, obstetrics or gynecology, ophthalmology, pulmonology, and urology. Error bars indicate 95% CIs. DME indicates durable medical equipment.

